
Why Win Rate Is the Most Misleading Number in Trading – A Deep Dive for Retail Traders

Why Win Rate Is the Most Misleading Number in Trading
Win rate looks clean on paper, but it tells you almost nothing about how a strategy will grow a trading account. A 70% win rate can still lose money if the average loss outweighs the average win, while a 40% win rate can be highly profitable when winners are much larger than losers. The real drivers of profitability are R‑multiples, expectancy, and the size of the data sample you are analysing.
What Does Win Rate Actually Measure?
Win rate is simply the percentage of trades that close in profit. It is calculated as:
Win Rate = (Number of Winning Trades ÷ Total Trades) × 100%
Because it ignores how much was won or lost, win rate can be inflated by tiny, frequent gains that are quickly erased by a few large losers. For a trader focused on building a sustainable edge, this metric is a red herring.
Why R‑Multiples Matter More Than Win Rate
R‑multiples express each trade’s profit or loss relative to the risk taken on that trade. If you risk $1 (1R) and make $2, the trade is a +2R. If you lose the $1, it is –1R. By aggregating R‑multiples you see the true shape of your performance:
- Average R‑multiple – the mean of all R‑values, indicating whether the system is, on average, adding or subtracting value.
- Distribution of R‑values – shows whether a few big winners are carrying many small losers, or vice‑versa.
Because R‑multiples are scaled to the size of the trade’s risk, they are comparable across different setups, instruments, and account sizes. A strategy that consistently generates +1.5R on winners and only –0.5R on losers will be profitable even with a modest win rate.
Expectancy: The Single Metric That Captures Both Win Rate and R‑Multiples
Expectancy combines win rate, average win size, and average loss size into one number that predicts long‑term growth per trade. The formula is:
Expectancy = (Win Rate × Average Win) – ((1 – Win Rate) × Average Loss)
When expressed in R‑multiples, expectancy becomes a direct estimate of how many R‑units you can expect to add to your account per trade. A positive expectancy means the system should grow over time, regardless of the win rate.
Example (no fabricated data, just illustrative):
- Win Rate = 45%
- Average Win = +2R
- Average Loss = –1R
How Sample Size Skews Win Rate Perception
Small sample sizes produce volatile win rates that can mislead even experienced traders. A 10‑trade sample with 8 winners yields an 80% win rate, but the next 10 trades could flip to 30% – a swing that tells you nothing about the underlying edge. Statistical confidence grows with the number of trades; the larger the sample, the more the win rate stabilises around its true value.
Rule of thumb: treat any win rate derived from fewer than 100 trades as provisional. Use tools that automatically log every trade and calculate rolling metrics so you can see how win rate, R‑multiples, and expectancy evolve as the sample expands.
Comparing Win Rate, R‑Multiples, and Expectancy
| Metric | What It Shows | Key Limitation |
|---|---|---|
| Win Rate | Percentage of profitable trades | Ignores size of wins/losses |
| Average R‑Multiple | Mean profit/loss per unit of risk | Requires consistent risk sizing |
| Expectancy | Projected R‑gain per trade (combines win rate & size) | Depends on accurate average win/loss estimates |
Practical Steps to Stop Over‑Emphasising Win Rate
- Record every trade automatically. Manual spreadsheets often miss slippage or partial fills; an automatic journal captures the exact entry, exit, and risk.
- Calculate R‑multiples for each trade. Divide profit/loss by the amount you risked. This normalises results across different setups.
- Compute rolling expectancy. Update the expectancy after each new trade to see how the edge evolves.
- Watch sample size. Set a minimum threshold (e.g., 100 trades) before drawing conclusions about win rate.
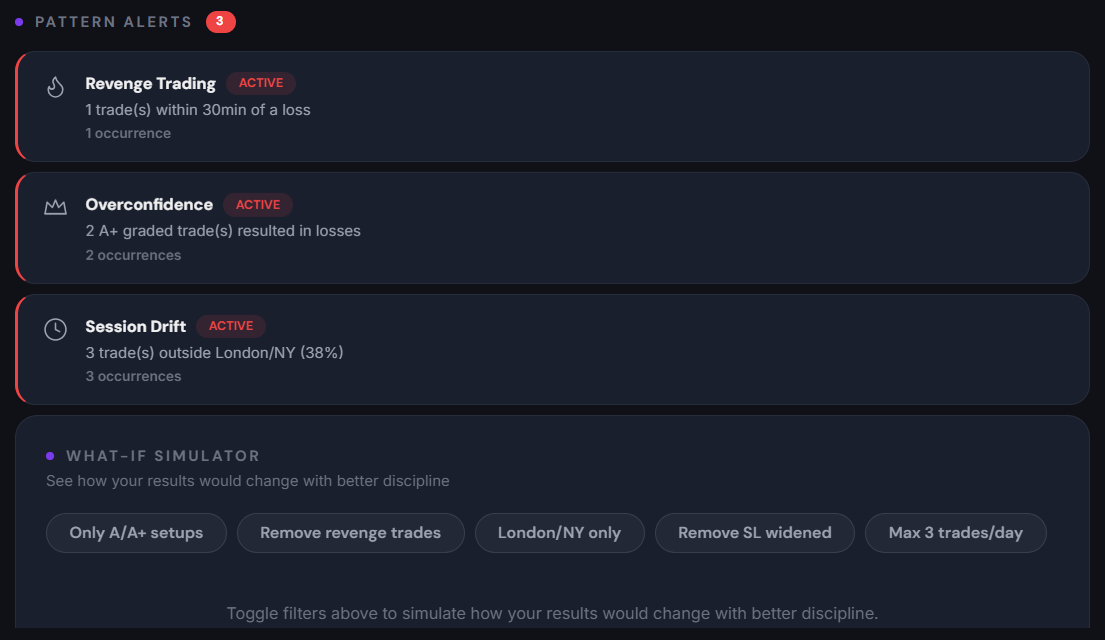
- Use behavioural analytics. Track consistency and discipline metrics to ensure that high‑win‑rate periods aren’t the result of over‑trading or rule‑breaking.
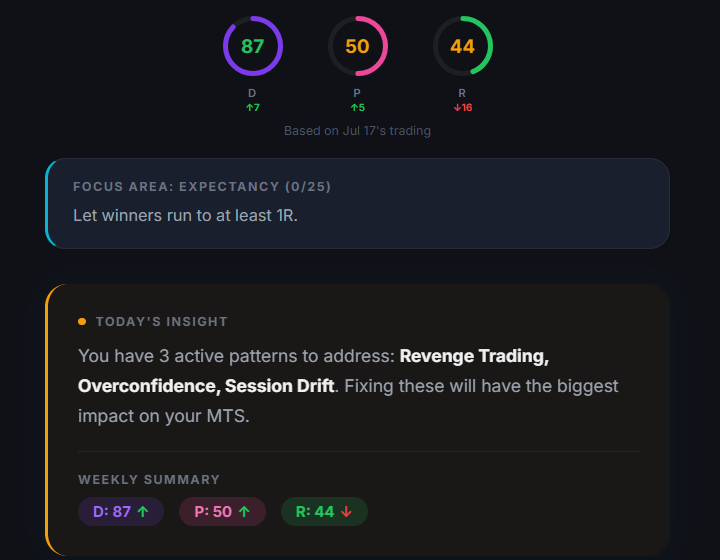
Platforms that combine automatic journaling with behavioural analytics make these steps painless. Tim Edge, for example, logs each trade, calculates R‑multiples, and updates expectancy in real time, helping traders keep the focus on what truly matters.
Common Mistakes When Relying on Win Rate
- Chasing high win rates. Traders may tighten stops or reduce position size to boost win rate, inadvertently shrinking the average win and eroding expectancy.
- Ignoring risk‑reward ratios. A 90% win rate with a 1:3 risk‑reward (risk $1 to make $0.33) will lose money over time.
- Over‑optimising on past data. Optimising a strategy to hit a target win rate on historical data often creates look‑ahead bias, making future performance unreliable.
- Failing to account for transaction costs. Small wins can be wiped out by commissions, spreads, and slippage, a factor win rate never reflects.
The Bottom Line
Win rate is a tempting headline metric, but it masks the true drivers of profitability. By focusing on R‑multiples, expectancy, and ensuring a robust sample size, traders gain a clearer picture of whether their edge will survive the market’s ups and downs. Shift your analysis from “how often do I win?” to “how much do I earn per unit of risk?” and let the numbers that truly matter guide your decisions.