
Risk of Ruin: The Math Every Prop Trader Ignores – How Position Sizing and Daily‑Loss Limits Interact
Risk of Ruin: The Math Every Prop Trader Ignores
Every prop trader who focuses only on win rate or average R‑multiple is missing the single most important calculation – the probability that a losing streak will wipe out the account, known as risk of ruin. The core of that calculation is simple: how much you risk on each trade (position sizing) and how much you are willing to lose in a day (daily‑loss limits). When those two numbers are not aligned, a few bad trades can erase weeks of profit.
Why position sizing matters more than win rate
Position sizing is the process of converting a risk percentage into a concrete trade size. For example, a 2% risk on a $20,000 account means you would risk $400 on each trade. The math behind risk of ruin starts with that $400 figure because it defines the size of each step in a random walk of wins and losses.
Win rate alone tells you how often you win, but it says nothing about how big each win or loss is. A trader who wins 70% of the time but loses 3× the average win will still have a high probability of ruin if the per‑trade risk is too large.
How daily‑loss limits interact with position sizing
Prop firms impose daily‑loss limits to protect their capital. The limit is usually a fixed dollar amount or a percentage of the account. If your per‑trade risk is 2% and the daily‑loss limit is 5%, you can only afford two losing trades before the limit forces you out.
This creates a natural cap on the number of consecutive losses you can survive. The math is straightforward: max consecutive losses = floor(daily‑loss limit ÷ per‑trade risk). In the example above, floor(5% ÷ 2%) = 2. Anything beyond that triggers a stop‑out, regardless of the overall edge.
Streak math: estimating the probability of a ruinous run
Assume a trader has a win probability p and a loss probability q = 1‑p. The chance of experiencing k consecutive losses is q^k. If the daily‑loss limit allows k losses, the daily ruin probability is exactly that value.
For a trader with a 55% win rate (p=0.55, q=0.45) and a daily‑loss limit that tolerates three losses, the daily ruin probability is 0.45³ ≈ 9.1%. Over a 20‑day month, the chance of at least one ruinous day rises to 1‑(0.909)²⁰ ≈ 86%.
That simple exponentiation shows why ignoring streak math is dangerous: even a modest loss probability can explode when the allowed streak length is short.
Comparing common sizing approaches
| Approach | Typical risk per trade | Daily‑loss limit compatibility | Resulting max loss streak |
|---|---|---|---|
| Fixed 2% risk | 2% of account | 5% daily limit | 2 consecutive losses |
| Fixed 1% risk | 1% of account | 5% daily limit | 5 consecutive losses |
| Volatility‑scaled risk | Varies, avg ~1.5% | 5% daily limit | ~3 consecutive losses |
The table illustrates that a modest reduction in per‑trade risk dramatically expands the number of losing trades you can survive, cutting the daily ruin probability from single‑digit to fractions of a percent.
Step‑by‑step checklist to keep risk of ruin under control
- Determine your target daily‑loss limit. Most prop firms set it between 3% and 6% of the account.
- Choose a per‑trade risk that yields a comfortable streak buffer. Divide the daily limit by the number of losses you are willing to accept (usually 4‑6).
- Calculate the implied maximum streak. Use floor(daily‑loss limit ÷ per‑trade risk).
- Estimate the daily ruin probability. Raise the loss probability (q) to the power of the max streak.
- Adjust position size until the ruin probability meets your comfort level. A common target is < 1% daily ruin risk.
- Monitor actual streaks. If you see a run approaching the limit, consider tightening risk or pausing trading.
Following this routine turns an abstract concept into a concrete daily habit.
Where traders typically go wrong
- Over‑risking per trade. A 3%‑4% risk on a 5% daily limit leaves only one or two losses before a stop‑out.
- Ignoring variance. Even with a high win rate, market volatility can produce larger than average losses, effectively increasing the per‑trade risk.
- Setting daily limits too tight. A 2% daily limit with a 2% per‑trade risk gives no room for error – a single loss ends the day.
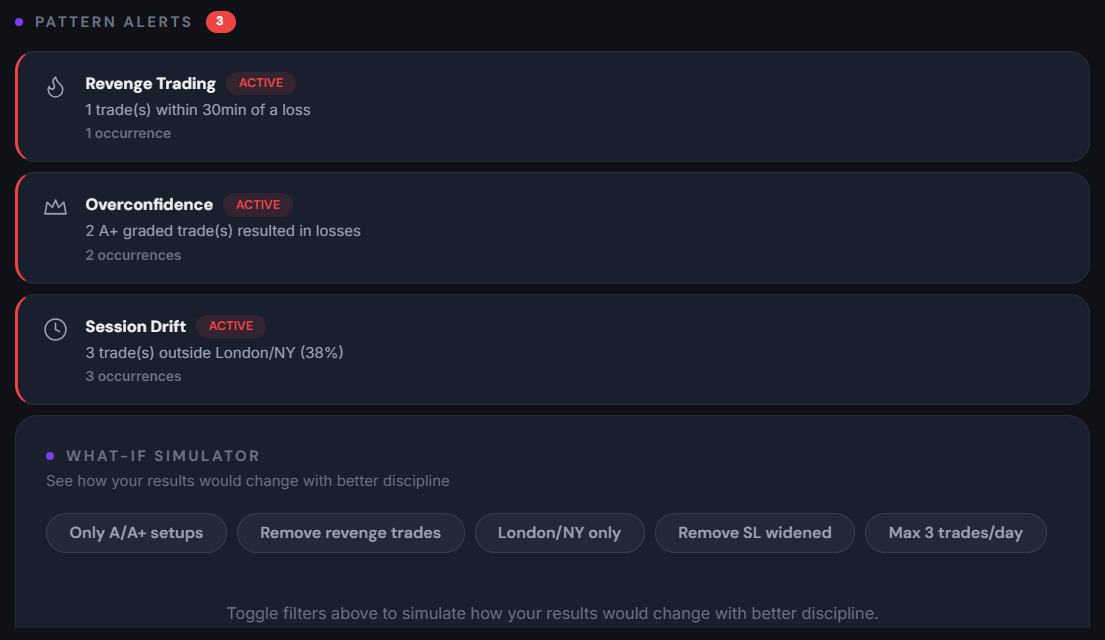
- Failing to log streaks. Without a journal that records consecutive losses, you cannot see the pattern that leads to ruin.
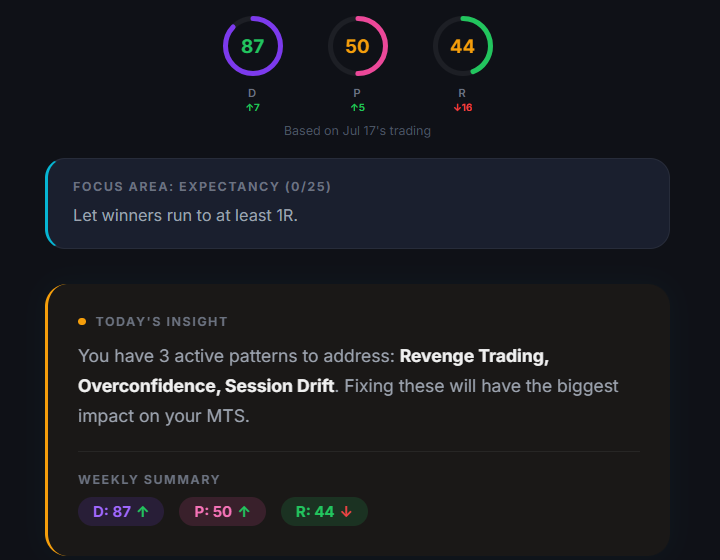
Tim Edge’s automatic trade journal records each trade, making it easier to track performance and identify risk‑management issues.
The bottom line
Risk of ruin is not a vague warning; it is a precise probability derived from the interaction of position sizing and daily‑loss limits. By calculating the maximum loss streak your account can survive and matching your per‑trade risk to that buffer, you turn a potentially catastrophic scenario into a manageable, data‑driven rule.