
Volume Profile: POC, VAH and VAL — How Price Reacts to Them
Volume Profile: POC, VAH and VAL — How Price Reacts to Them
Traders who watch the market’s order flow know that the Volume Profile is more than a heat‑map of traded volume; it pinpoints the price levels where the market spent the most time. The three key reference points—Point of Control (POC), Value Area High (VAH) and Value Area Low (VAL)—act as magnets or barriers, depending on whether the market is accepting or rejecting them. In this article we break down exactly how price typically behaves around these zones, why “fat” and “thin” nodes matter, and how you can incorporate the insights into a disciplined trading plan.
What are POC, VAH and VAL?
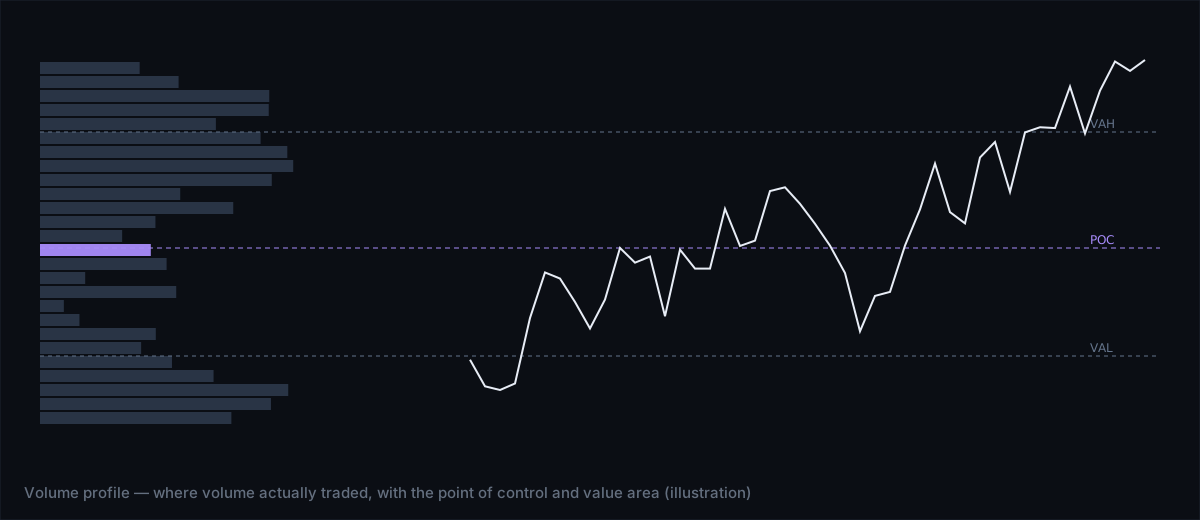
The Volume Profile distributes every traded contract (or ounce) across the price axis. After the profile is built, three levels are highlighted:
- Point of Control (POC) – the price level with the highest total volume. Think of it as the market’s favorite price.
- Value Area High (VAH) – the upper bound of the “value area”, the range that contains roughly 70% of the total volume around the POC.
- Value Area Low (VAL) – the lower bound of that same 70% range.
Because the value area captures the bulk of trading activity, the market often treats VAH and VAL as dynamic support and resistance. The POC, sitting at the centre of the cluster, can act as a pivot or a magnet that pulls price back when it wanders too far.
Acceptance vs. Rejection: How Price Interacts with the Levels
When price approaches any of these levels, two outcomes are possible:
- Acceptance – the market acknowledges the level, often pausing, consolidating, or bouncing off it. Acceptance is signalled by a “fat” node (high volume) at the level and a lack of aggressive selling or buying pressure.
- Rejection – price quickly moves away, indicating that the level is no longer attractive. Rejection is usually accompanied by a “thin” node (low volume) and a burst of market‑order flow that pushes price through.
Understanding which of these scenarios is playing out helps you decide whether to trade a bounce (acceptance) or a break‑and‑run (rejection).
Fat Nodes vs. Thin Nodes: Reading the Volume Profile’s Shape
A “node” is simply a bar on the profile that represents the amount of volume at a particular price. The visual thickness of a node tells you how much interest traders had at that price:
- Fat nodes – high concentration of volume. They indicate strong interest, often because large institutions placed orders there. Fat nodes at VAH or VAL suggest those levels will hold.
- Thin nodes – low concentration of volume. They reveal price levels that the market passed through quickly, typically with little participation. Thin nodes at the POC can be a warning sign that the market may not respect the central price.
When a thin node sits directly on a VAH or VAL, the level is fragile. A single aggressive order can tear through it, turning a potential support into a breakout point.
Practical Trading Tactics Around POC, VAH and VAL
Below is a step‑by‑step checklist you can use each time a new profile is generated (e.g., on a 30‑minute chart for Bitcoin or a 1‑hour chart for Gold). The steps are deliberately simple so they can be automated in a journal or an AI‑driven strategy builder.
- Identify the POC, VAH and VAL on the current profile.
- Assess node thickness at each level:
- Fat node → treat as strong support/resistance.
- Thin node → treat as weak, watch for breakouts.
- Observe the price action as it nears the level:
- If price stalls and volume spikes, mark it as acceptance. Consider a reversal entry with a stop just beyond the level.
- If price spikes through with little volume, mark it as rejection. Consider a continuation entry on the breakout side, with a stop inside the profile.
- Check the surrounding order‑flow lenses (e.g., cumulative volume delta, liquidity heatmap) for confirming pressure. A bullish delta on a VAH bounce adds confidence; a bearish delta on a VAH break strengthens a breakout bias.
- Log the outcome in an automatic trade journal. Record whether the level acted as acceptance or rejection, node thickness, and any supporting flow signals. Over time the journal will reveal which levels you trade most successfully.
Comparing POC, VAH and VAL Reactions Across Market Conditions
| Market Condition | Typical POC Behaviour | Typical VAH Behaviour | Typical VAL Behaviour |
|---|---|---|---|
| Low volatility, range‑bound | Acts as a magnet; price frequently returns. | Strong support/resistance; frequent bounces. | Strong support/resistance; frequent bounces. |
| High volatility, trending | Often broken; thin node may turn into a breakout point. | May act as a barrier if node is fat; otherwise broken. | Same as VAH. |
| News‑driven spikes | Rapid rejection; thin node leads to overshoot. | Thin nodes get torn through; fat nodes may hold briefly. | Thin nodes give way; fat nodes can become new POC. |
Common Mistakes When Trading Volume Profile Levels
Even experienced traders slip up. Here are the most frequent errors and how to avoid them:
- Treating every POC as a guaranteed reversal. In a strong trend the POC can become a “magnet” that pulls price forward, not backward.
- Ignoring node thickness. A thin VAH looks like resistance, but without volume behind it the price will likely break.
- Placing stops too tight. Because order‑flow can cause short‑term whipsaws, give the price a few ticks to confirm acceptance before exiting.
- Over‑relying on one time‑frame. A level that is fat on a 5‑minute profile may be thin on a 4‑hour profile. Cross‑check multiple resolutions.
Integrating Volume Profile with Other Flow Lenses
Volume Profile works best when combined with complementary tools that show real‑time aggression:
- Cumulative Volume Delta (CVD) – measures the net buying vs. selling pressure. A bullish CVD on a VAH bounce confirms buying interest.
- Liquidity Heatmap – highlights where large orders sit. Overlap of a fat VAH node and a heatmap hotspot signals a robust barrier.
- Footprint Chart – displays bid‑ask imbalances at each price tick. If the footprint shows heavy buying at the POC, expect a pull‑back rather than a breakout.
When these lenses align, the probability of a successful trade rises; when they diverge, treat the situation as high risk.
The bottom line
POC, VAH and VAL are not static lines; they are dynamic reflections of where market participants concentrated their trades. Fat nodes at these levels usually mean acceptance and a higher chance of bounce, while thin nodes often precede rejection and breakout. By checking node thickness, watching price behavior, and confirming with other order‑flow lenses, you can turn the Volume Profile into a reliable decision‑making framework. Consistently logging each interaction in an automatic journal will let you refine the edge over time.