
Cumulative Volume Delta: Uncovering Hidden Order Flow Dynamics

Cumulative Volume Delta (CVD) is a crucial order flow term that reveals the difference between buying and selling pressure over time, and divergence between CVD and price is a key concept traders use to identify potential trading opportunities. By analyzing CVD, traders can gain insights into market intent and make more informed decisions. CVD is calculated by subtracting the volume of selling trades from the volume of buying trades at each price level, and divergence occurs when the CVD line and price chart are moving in opposite directions.
What is Cumulative Volume Delta?
Cumulative Volume Delta is a metric that helps traders understand the underlying dynamics of the market by tracking the cumulative difference between buying and selling volume. It's an important tool for order flow analysis, as it provides insights into the balance between buyers and sellers and helps traders identify potential trading opportunities.
How to Use Cumulative Volume Delta in Trading
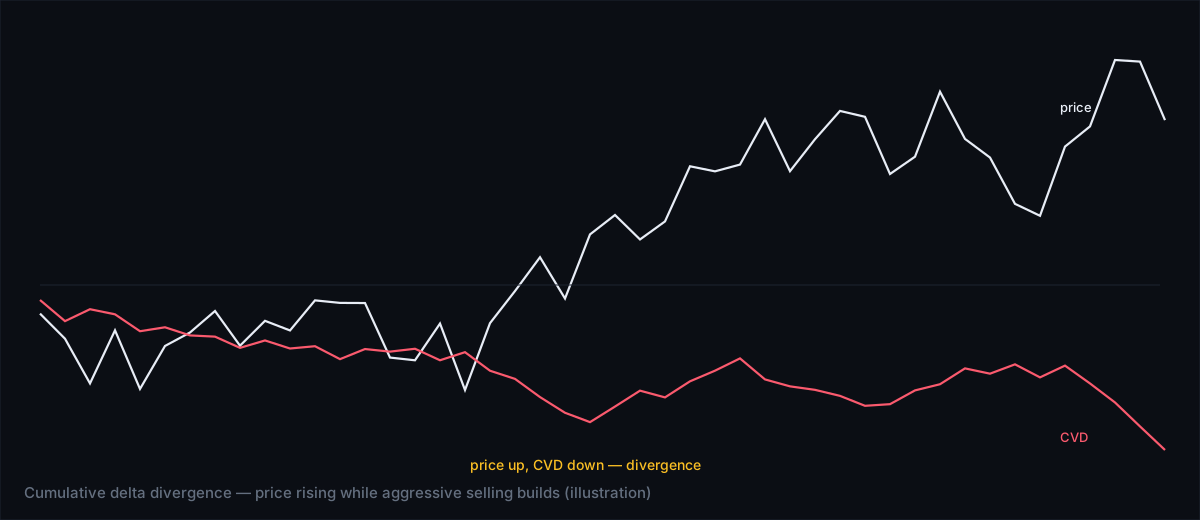
Traders use CVD to identify divergence between the CVD line and the price chart, which can indicate a potential change in market direction. For example, if the price is making new highs but the CVD line is not, it may indicate a lack of buying pressure and a potential reversal. Conversely, if the price is making new lows but the CVD line is not, it may indicate a lack of selling pressure and a potential bounce.
Cumulative Volume Delta Divergence
CVD divergence is a powerful tool for identifying potential trading opportunities. There are two types of divergence: bullish divergence and bearish divergence. Bullish divergence occurs when the CVD line is making new highs while the price is making new lows, indicating a potential buy signal. Bearish divergence occurs when the CVD line is making new lows while the price is making new highs, indicating a potential sell signal.
How Price Reacts to Cumulative Volume Delta
Price reaction to CVD is a critical aspect of order flow analysis. When the CVD line and price chart are moving in the same direction, it's known as convergence, and it can indicate a strong trend. However, when the CVD line and price chart are moving in opposite directions, it's known as divergence, and it can indicate a potential change in market direction.
Common Mistakes with Cumulative Volume Delta
- Not considering other order flow metrics, such as volume profile and footprint charts, in conjunction with CVD.
- Not accounting for changes in market conditions, such as shifts in volatility or liquidity.
- Not using CVD in combination with other forms of analysis, such as technical or fundamental analysis.
The bottom line
Cumulative Volume Delta is a powerful tool for order flow analysis that can help traders gain insights into market intent and make more informed decisions. By understanding how to use CVD and identifying divergence between the CVD line and price chart, traders can uncover hidden order flow dynamics and create trading opportunities. With practice and experience, traders can develop a deeper understanding of CVD and how to use it to improve their trading performance.