
Order Flow vs Price Action: What Candles Can't Show You – Deep Dive for Retail Traders
Order Flow vs Price Action: What Candles Can't Show You
Standard price‑action candles tell you where the market closed, opened, and the range it covered, but they hide the internal battle between buying and selling that actually moves the price. Order flow uncovers that battle by showing whether trades were driven by absorption (passive liquidity taking) or initiative (aggressive market orders). Understanding this difference lets you spot hidden strength or weakness that a candle alone can’t reveal.
Why candles alone are insufficient
A candle aggregates every trade that occurred in its time frame into four numbers: open, high, low, and close. While these numbers are useful for visual patterns, they flatten two very different market dynamics:
- Absorption: Large resting orders soak up aggressive buying or selling, creating a temporary pause even if price moves.
- Initiative: Aggressive market orders that break through resting liquidity, indicating strong intent.
If a candle closes near its high, you might assume bullish strength. But if the high was built on heavy absorption, the move could reverse once that liquidity is exhausted. Conversely, a candle that closes near its low might still contain a burst of initiative that signals a short‑term reversal.
How order‑flow reveals absorption and initiative
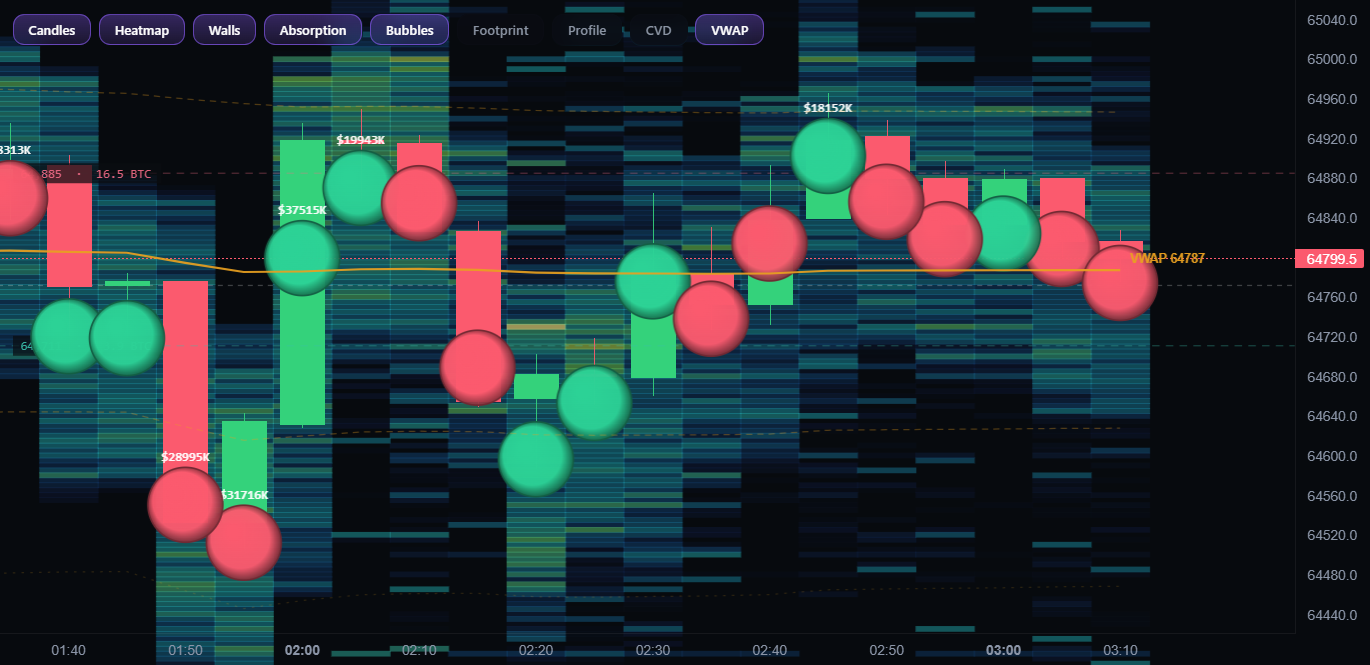
Order‑flow tools break a candle into its constituent trades, letting you see the exact sequence of buys and sells. The key metrics are:
- Cumulative Volume Delta (CVD): The running total of buy volume minus sell volume. A rising CVD while price is flat suggests buying pressure is being absorbed.
- Liquidity heatmap: Highlights zones where large orders sit. When price repeatedly hits a heat‑map hotspot without breaking through, absorption is likely.
- Footprint chart rows: Show the number of contracts traded at each price level, making it easy to spot aggressive market orders (large imbalance) versus passive fills.
When you pair these with the candle’s shape, you can label the same candle as:
- Absorbing bullish candle – price makes a higher high, but CVD stalls and heatmap shows heavy sell‑side liquidity.
- Initiative‑driven bearish candle – price drops, CVD plunges, and footprint rows show aggressive market orders overwhelming resting bids.
Practical ways to combine order flow with price action
Below is a step‑by‑step workflow you can apply on any chart, whether you trade Bitcoin, Gold, or any other asset:
- Identify the candle pattern you would normally trade (e.g., bullish engulfing, pin bar).
- Open the order‑flow window for the same time interval.
- Check CVD: if it moves in the same direction as the candle, the move has initiative; if it stalls or reverses, absorption is dominant.
- Scan the liquidity heatmap for clusters at the candle’s high/low. A cluster at the high with flat CVD = absorption; a cluster at the low with steep CVD = initiative.
- Confirm with footprint rows: a strong bid‑ask imbalance on the side you expect continuation adds confidence.
- Enter only if initiative aligns with your price‑action signal; otherwise, treat the candle as a false breakout and wait for a confirming move.
Using this workflow prevents you from chasing moves that look strong on a chart but are merely the market soaking up liquidity.
Order‑flow vs price‑action: a side‑by‑side comparison
| Aspect | Price Action (Candles) | Order Flow |
|---|---|---|
| Data granularity | Aggregated per time bar | Tick‑level, each trade visible |
| Shows initiative? | Only implied by price direction | Explicit via CVD, footprint imbalance |
| Detects absorption? | No | Yes – heatmap, volume clusters |
| Bias to lag? | Higher – price reflects past trades | Lower – real‑time trade flow |
| Complexity | Low – easy to read | Higher – requires interpreting multiple layers |
Common pitfalls when mixing the two
Even experienced traders can misinterpret order‑flow signals. Here are the most frequent mistakes and how to avoid them:
- Reading a single CVD spike as a trend change: A brief surge may be a large institutional order that gets quickly absorbed. Look for sustained CVD movement across several bars.
- Ignoring the candle’s context: Order flow can’t replace the macro view that price patterns give. A strong initiative signal inside a long‑term downtrend still requires a higher‑time confirmation.
- Over‑relying on heatmap colors: Heatmaps are visual aids; they don’t quantify order size. Pair them with footprint rows to verify the actual volume.
- Failing to journal the internal dynamics: Without a trade journal that records CVD, absorption flags, and initiative notes, you won’t be able to review what worked. Automated journaling tools, such as those on Tim Edge, can capture these metrics without manual entry.
When to trust candles over order flow
There are scenarios where the extra detail of order flow adds noise rather than value:
- Low‑liquidity periods (e.g., overnight sessions) where tick data is sparse and CVD swings erratically.
- Long‑term swing trading where the focus is on broader trend structures; the fine‑grained order‑flow picture may distract from the bigger picture.
- When you lack a reliable order‑flow feed for the instrument you trade; a solid price‑action setup is better than guessing.
In those cases, use candles as the primary signal and treat order flow as a secondary filter.
The bottom line
Candles give you the outline of price movement, but order flow fills in the story of who is driving that movement. By distinguishing absorption from initiative, you can filter out false breakouts and align your entries with genuine market intent. Integrate the step‑by‑step workflow, avoid common pitfalls, and let an automated journal capture the hidden metrics—your edge becomes data‑driven, not just pattern‑driven.