
Footprint Charts: Uncovering Hidden Order Flow Dynamics for Day Traders

Footprint charts are a powerful tool for day traders looking to uncover hidden order flow dynamics, including bid/ask imbalance, delta, and the point of control (POC). By analyzing these charts, traders can gain valuable insights into market sentiment and make more informed trading decisions.
What is a Footprint Chart?
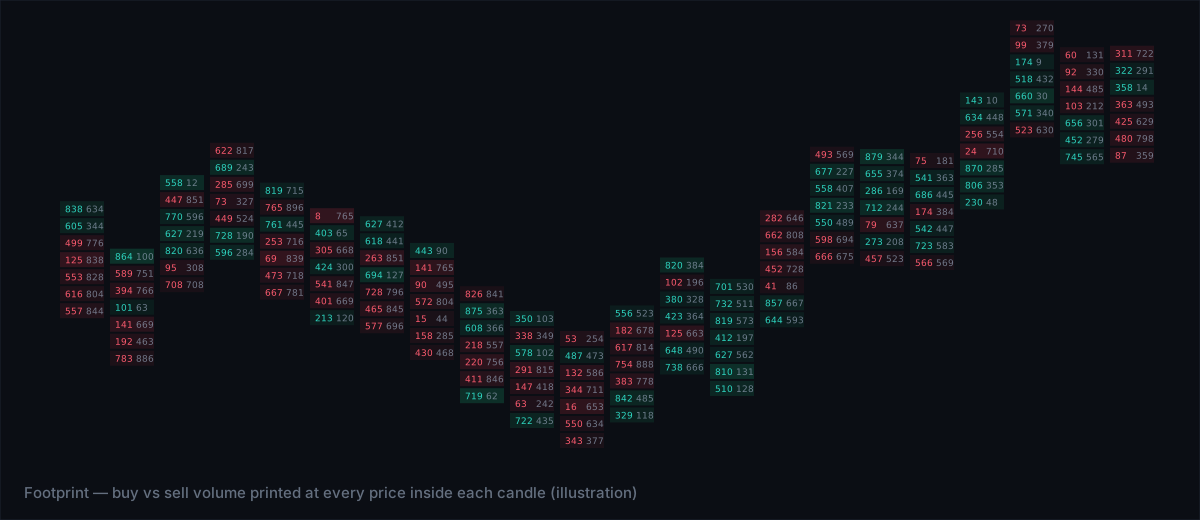
A footprint chart is a type of chart that displays the relationship between price and order flow, allowing traders to visualize the dynamics of market activity. It is essentially a histogram (a graphical representation of the distribution of data) that shows the bid/ask imbalance, which is the difference between the number of buy and sell orders at a given price level.
Understanding Bid/Ask Imbalance
Bid/ask imbalance occurs when there are more buy or sell orders at a particular price level, indicating an imbalance in market sentiment. This imbalance can be a powerful indicator of potential price movement, as it suggests that there is more aggressive (i.e., market-order) buying or selling activity at that price level.
Delta and its Role in Footprint Charts
Delta refers to the cumulative difference between the number of buy and sell orders, and is often used to confirm the presence of bid/ask imbalance. A positive delta indicates that there are more buy orders, while a negative delta indicates that there are more sell orders. By analyzing delta in conjunction with bid/ask imbalance, traders can gain a more complete understanding of market sentiment and potential price movement.
Identifying the Point of Control (POC)
The point of control (POC) is the price level at which the most trading activity has occurred, and is often used as a reference point for analyzing bid/ask imbalance and delta. The POC can be thought of as the fair value of the market, and traders often use it to identify potential areas of support and resistance.
Reading Footprint Charts for Day Trading
To read footprint charts for day trading, traders should look for the following:
- Bid/ask imbalance: Look for areas where there is a significant imbalance between buy and sell orders, as this can indicate potential price movement.
- Delta: Confirm the presence of bid/ask imbalance by analyzing delta, and look for areas where delta is changing rapidly.
- POC: Identify the point of control and use it as a reference point for analyzing bid/ask imbalance and delta.
- Absorption: Look for areas where the market is absorbing (i.e., buying up) or rejecting (i.e., selling off) orders, as this can indicate potential areas of support and resistance.
The Bottom Line
Footprint charts offer a unique perspective on market activity, allowing traders to uncover hidden order flow dynamics and make more informed trading decisions. By analyzing bid/ask imbalance, delta, and the point of control, traders can gain a deeper understanding of market sentiment and potential price movement, and use this information to inform their day trading decisions.