
Footprint Charts for Beginners: How to Read Buyers vs Sellers Inside Every Candle

Footprint charts let you see who is winning the battle inside every candle
When a candle closes, most traders only see the high, low, open and close. A footprint chart splits that candle into a grid of bid × ask cells, showing the exact number of contracts or coins that traded at each price level. By looking at the distribution of those cells you can tell whether buyers or sellers were in control, where pressure built, and whether the move is likely to continue or reverse.
What is a footprint chart and how does it differ from a regular candlestick?
A standard candlestick aggregates all trades that occurred within a time interval into four prices: open, high, low and close. It tells you the net result but hides the internal flow. A footprint chart adds a second dimension – the volume at each price – and separates that volume into bid (sell‑initiated) and ask (buy‑initiated) sides. The result is a matrix that looks like a tiny heat‑map inside the candle.
The key terms you will encounter:
- Bid × Ask cells: the number of trades that hit the bid (selling) versus the ask (buying) at a specific price.
- Delta: the net difference between ask volume and bid volume (Ask – Bid). Positive delta means buying pressure; negative delta means selling pressure.
- Imbalance: a price level where one side dominates the other by a large margin, often a precursor to a breakout or reversal.
- Exhaustion: a pattern where delta shrinks or flips sign after a strong move, indicating that the dominant side is losing steam.
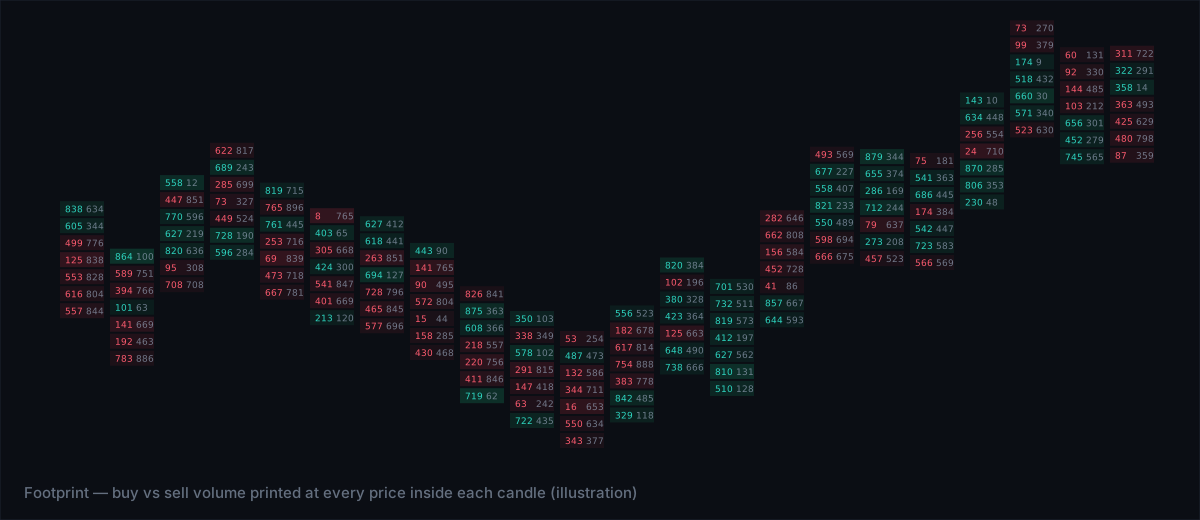
How to read buyers vs sellers inside a single candle
- Identify the dominant side. Scan the footprint for rows where ask volume consistently exceeds bid volume. If the majority of cells are green (or marked “A”), buyers are in control.
- Check the delta profile. Add a delta histogram (often shown at the right of the footprint). A rising delta line signals accumulating buying pressure; a falling line signals selling pressure.
- Spot imbalances. Look for cells where the ratio of ask to bid is, for example, 3:1 or higher. Those levels act as magnet points – price may return to them later.
- Watch for exhaustion. If delta peaks early in the candle and then tapers off or reverses, the initial aggressors may be running out of orders.
- Confirm with price action. Combine the footprint clues with the candle’s shape. A bullish candle with strong positive delta and few imbalances usually confirms a genuine up move.
Common footprint patterns and what they mean
| Pattern | Visual cue on footprint | Interpretation |
|---|---|---|
| Strong buying | Ask volume dominates most rows; delta line slopes upward | Buyers are absorbing sell orders, likely to push price higher |
| Strong selling | Bid volume dominates; delta line slopes downward | Sellers are taking liquidity, price may keep falling |
| Bid‑ask imbalance | One or two rows with a 4:1 or greater ratio | Potential support/resistance; price may bounce or break through |
| Delta exhaustion | Delta peaks then flattens or reverses within the candle | Initial aggressors are tiring; reversal risk rises |
| Footprint wash | Bid and ask volumes are nearly equal across rows | Market indecision; watch for a breakout on the next candle |
Practical steps to incorporate footprint analysis into your routine
- Set up the footprint lens. Use a platform that offers a bid × ask grid with delta overlay. Tim Edge’s Flow lens provides exactly this view for Bitcoin and Gold.
- Define an imbalance threshold. Many traders use a 3:1 ratio as a starting point; adjust based on the instrument’s typical volume profile.
- Mark key levels. Draw horizontal lines at rows with strong imbalances; these become reference points for entry, stop or target.
- Combine with higher‑time context. A bullish footprint on a 5‑minute chart is more reliable if the 30‑minute trend is also up.
- Log what you see. Record the delta direction, any imbalances, and whether the candle ended in exhaustion. Over time you’ll see which signals correlate with profitable outcomes.
Limitations and pitfalls to avoid
Footprint charts are powerful, but they are not a crystal ball. The main limitations are:
- Data quality. The accuracy of bid‑ask breakdown depends on the feed. Gaps or missing ticks can distort delta.
- Over‑interpretation. A single imbalance does not guarantee a move; it’s a clue that must be confirmed by price action or broader market context.
- Speed of tape. In very fast markets the footprint may lag, especially on lower‑time frames. Consider using a sub‑second execution environment if you plan to act on the signal instantly.
- Psychology. Seeing a strong buying footprint can create a bias toward long positions. Always respect your risk rules.
The bottom line
Footprint charts turn every candle into a transparent ledger of who is winning the trade – buyers or sellers. By reading bid × ask cells, delta, imbalances and exhaustion you gain a real‑time edge that standard candlesticks hide. Use the patterns, log your observations, and combine the insight with higher‑time trends to make disciplined, data‑driven decisions.