
Liquidity Heatmaps Explained: How to Read the Walls and Spot Pull‑Vs‑Defended Zones

Liquidity heatmaps explained: reading the walls
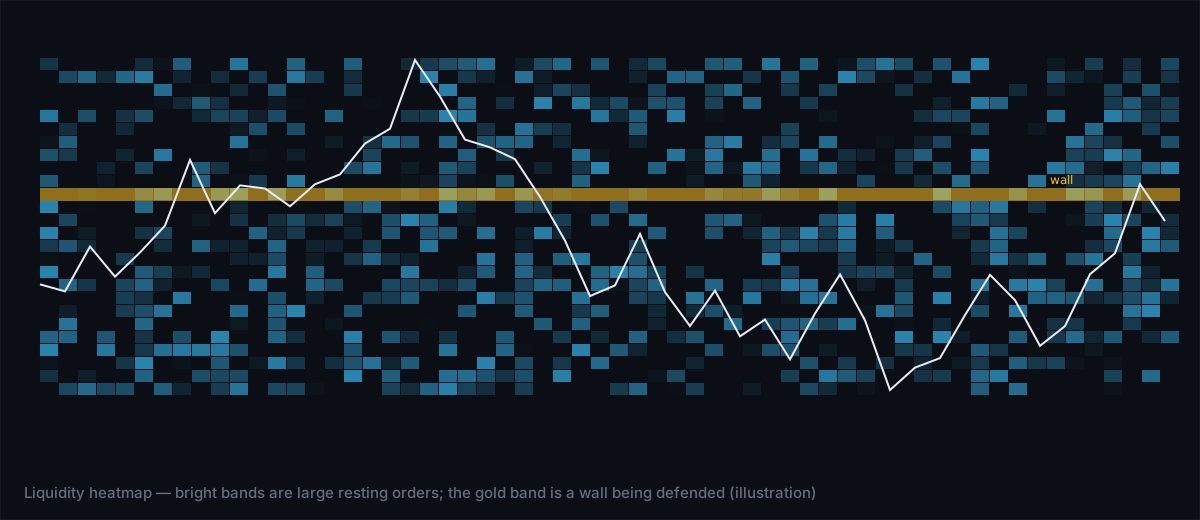
Liquidity heatmaps translate raw order‑book depth into a visual brightness map where the intensity of each pixel represents the size of resting orders. The brighter the spot, the larger the pool of unfilled limit orders waiting at that price. For an experienced trader, the real edge comes from recognizing when a bright area is being pulled (orders disappearing) versus when it is being defended (orders replenishing as price approaches).
Why wall dynamics matter more than the raw heatmap
A static heatmap tells you where liquidity sits, but it does not reveal the market participants’ intent. A pulled wall suggests that a large trader is removing resistance or support to force a breakout, while a defended wall indicates that the same level is being protected, often by the same institution that placed the original orders. Spotting the shift between these two states can turn a neutral price level into a high‑probability entry or exit.
How to identify a pulled wall
- Watch brightness decay. When a bright zone suddenly dims over a few seconds, the underlying resting orders are being cancelled faster than new orders are added.
- Check the tape speed. A rapid increase in trade‑size volume (the "speed of tape" lens) concurrent with the dimming indicates aggressive market orders eating through the liquidity.
- Look for a gap in the order‑flow delta. Cumulative Volume Delta (CVD) will show a sharp swing toward the side that is taking liquidity, confirming that the wall is being consumed.
- Confirm with price action. If price begins to move through the dimming zone without stalling, the wall is likely pulled rather than defended.
How to identify a defended wall
- Brightness rebounds. After an initial dip, the heatmap brightens again at the same price level, showing that new limit orders are being placed to replace the ones taken.
- Iceberg detection. Iceberg detection flags hidden large orders that reappear after being partially filled, a classic sign of a defended wall.
- Absorption spikes. When aggressive buying meets a bright sell wall and the CVD flattens, the market is absorbing the liquidity rather than breaking through.
- Volume profile alignment. The defended price often aligns with the Point of Control (POC) or the Value Area High/Low (VAH/VAL) on the volume profile, reinforcing its significance.
Practical workflow for reading walls in real time
Below is a step‑by‑step routine you can run on a live heatmap screen. The steps assume you have the heatmap, CVD, speed‑of‑tape, and iceberg detection lenses active.
- Locate the brightest clusters on the heatmap. These are your candidate walls.
- Note the exact price levels and record the current brightness value (e.g., "brightness 78").
- Switch to the speed‑of‑tape lens. If you see a surge >200 contracts per second at a candidate wall, flag it for further analysis.
- Observe the CVD for a corresponding delta swing. A swing toward the side taking liquidity confirms activity.
- Watch the heatmap for the next 5‑10 seconds:
- If brightness drops >20% and stays low, label the wall as pulled.
- If brightness recovers to within 10% of the original level, label it as defended.
- Cross‑check with the volume profile: does the wall sit near the POC or VAH/VAL? If yes, the wall is likely a strategic level for larger participants.
- Enter a trade only after the wall classification aligns with your strategy:
- Pulled wall → consider a breakout trade in the direction of the delta swing.
- Defended wall → consider a reversal or bounce trade, placing stops just beyond the wall.
Comparing pulled vs defended walls across Bitcoin and Gold
| Aspect | Bitcoin (high volatility) | Gold (lower volatility) |
|---|---|---|
| Typical brightness level | 70‑90 (large order clusters appear quickly) | 50‑70 (liquidity builds more slowly) |
| Pull frequency | Frequent during news spikes; walls can disappear in seconds | Less frequent; walls tend to persist longer |
| Defend mechanism | Iceberg re‑placement by large bots | Institutional hedgers re‑posting at round numbers |
| Trade bias | Breakout bias after a pulled wall | Mean‑reversion bias after a defended wall |
Common pitfalls when reading heatmap walls
- Confusing a temporary dip with a pulled wall. A brief brightness dip can be a normal order‑book refresh. Always wait for at least a few seconds of sustained dimming.
- Ignoring the broader market context. A defended wall in a strong trending market may still be broken; combine wall analysis with trend direction.
- Relying on a single lens. Use heatmap brightness together with CVD, speed‑of‑tape, and iceberg detection to avoid false signals.
- Over‑trading small walls. Walls with brightness below the 40‑50 range often represent retail liquidity and lack the depth to move price meaningfully.
Integrating wall analysis with Tim Edge tools
Tim Edge’s Flow terminal bundles the heatmap, CVD, speed‑of‑tape, and iceberg detection in a single browser view. The platform also journals every wall‑event, letting you review how often pulled versus defended walls led to successful breakouts or reversals. By reviewing the journal, you can quantify your personal edge with wall‑based trades.
The bottom line
Liquidity heatmaps become truly powerful when you move beyond static brightness and start reading the dynamics of walls. A pulled wall signals aggressive order‑flow that can fuel a breakout; a defended wall shows protective liquidity that often creates a bounce point. Combine heatmap brightness with CVD, speed‑of‑tape, and iceberg detection, and you’ll have a systematic way to turn hidden liquidity into actionable trade ideas.