
Liquidity: The Real Force Behind Every Price Move – Resting vs Market Orders, Magnet and Wall Dynamics

Liquidity: The Real Force Behind Every Price Move
Liquidity – the pool of buy and sell orders waiting in the market – is the engine that powers every price move. When a trader sends a market order, it hunts for the nearest resting orders, and the interaction creates the price action you see on the chart. Understanding how resting orders and market orders interact to form liquidity magnets and walls lets you read the market’s true intent.
What are Resting Orders and Market Orders?
Resting orders are limit orders that sit in the order book until a counter‑party hits them. They represent the supply (sell limit) or demand (buy limit) that traders are willing to provide at specific price levels. Market orders are instructions to buy or sell immediately at the best available price; they consume the nearest resting orders.
Because markets are a continuous auction, price moves only when a market order finds enough resting liquidity to fill. If the resting pool is thin, even a small market order can push price far, creating a rapid swing. Conversely, deep resting liquidity acts like a cushion, absorbing larger market orders with modest price impact.
How Resting Liquidity Forms Magnet and Wall Levels
A liquidity magnet is a cluster of resting orders that draws price toward it. When price approaches a magnet, the probability of execution increases because many traders have placed orders near that level. The market “feels” the magnet and often slows, consolidates, or reverses as participants trade into the pool.
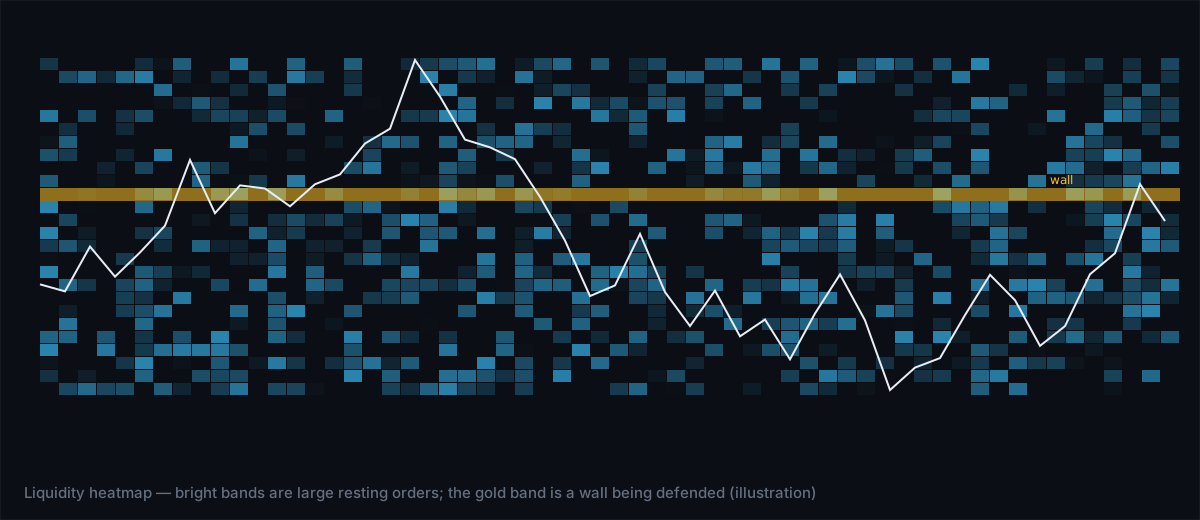
A liquidity wall is a larger concentration of resting orders that can block price from moving past it. A wall can be a sell wall (many sell limit orders above the current price) or a buy wall (many buy limit orders below). When a wall is strong enough, market orders must consume a sizable amount of liquidity before breaking through, which can cause a noticeable pause or a bounce.
Both magnets and walls are dynamic; they appear, shift, and disappear as traders add or cancel orders. Detecting them in real time requires a view of the order‑flow landscape – a liquidity heatmap, footprint chart, or volume‑profile overlay can reveal where the clusters sit.
Why Magnets and Walls Matter for Traders
- Entry timing – Entering near a magnet increases the chance of a quick fill and often aligns you with the prevailing market intent.
- Risk management – Placing stop‑losses just beyond a strong wall can reduce the likelihood of being stopped out by a temporary price spike.
- Trade direction – A break above a sell wall suggests aggressive buying pressure; a break below a buy wall signals strong selling pressure.
- Liquidity hunting – Some algorithms deliberately target thin zones to cause a rapid move, then retreat. Recognising these “liquidity hunts” helps you avoid being caught on the wrong side.
How Market Orders Interact with Liquidity Walls
When a large market order hits a wall, two outcomes are possible:
- Absorption: The wall absorbs the order, and price stalls near the wall. Traders may interpret this as a sign that the market respects the price level.
- Breakout: If the market order size exceeds the wall’s depth, the price will punch through, often with a sharp, impulsive move. The breakout can trigger stop‑loss orders on the other side, adding further momentum.
The key to reading the situation is the wall’s depth relative to the typical order size in that instrument. A wall that looks massive on a low‑liquidity market may be shallow in a high‑liquidity market, and vice versa.
Practical Ways to Spot Magnets and Walls
Below is a quick checklist you can apply while watching a chart:
- Look for clusters on the liquidity heatmap where color intensity spikes – these are likely magnets.
- Check the footprint chart for rows where bid‑volume or ask‑volume dominates for several ticks – a sign of a wall forming.
- Use a volume‑profile overlay (POC, VAH, VAL) to see where large volumes have accumulated over the last 3 days; the POC (point of control) often acts as a magnet.
- Watch for rapid order‑flow changes: a sudden surge of market orders that eats through a cluster indicates a potential breakout.
- Monitor iceberg detection – hidden large orders that appear as a series of small fills can be the core of a wall.
When you identify a magnet, consider entering a trade that aligns with the flow toward it. When you see a wall, decide whether you want to test its strength (by placing a small aggressive order) or stay on the other side.
Common Mistakes When Trading Liquidity Levels
Even seasoned traders slip up:
- Assuming static walls – Walls shift as participants cancel or add orders. Treat them as a snapshot, not a permanent barrier.
- Ignoring order‑size context – A wall that looks large may be trivial compared to a multi‑lot market order. Always gauge relative depth.
- Chasing a magnet after it’s passed – Once price moves past a magnet, the remaining liquidity may be thin, increasing slippage.
- Over‑relying on a single tool – Combine heatmaps, footprint charts, and volume profile for a fuller picture.
Integrating Liquidity Insight with a Trading Workflow
Many traders use an automatic trade journal to record where they entered and exited relative to liquidity features. By tagging each trade with the magnet or wall level that influenced the decision, you can later analyse whether you consistently profit from those cues. Behavioural analytics can highlight if you’re repeatedly ignoring strong walls or over‑trading magnets, helping you tighten discipline.
For those who want to automate the process, an AI Strategy Builder can back‑test a rule that, for example, buys when price approaches a buy‑wall and the cumulative volume delta (CVD) shows buying pressure. Honest tick‑level backtesting on recorded market data ensures the rule respects real‑time order‑flow dynamics, not just candle‑based approximations.
The Bottom Line
Liquidity is the hidden force that moves price. Resting orders create magnets that attract price and walls that resist it. By watching how market orders consume or break through these clusters, you can anticipate moves, place smarter entries, and protect yourself from sudden spikes. Use heatmaps, footprint charts, and volume‑profile tools to locate the clusters, record your observations in a journal, and let behavioural analytics highlight where your decisions align—or misalign—with the true liquidity landscape.