Level 2, DOM and the Tape: Order Flow Terms Explained Simply – A Trader’s Glossary
Level 2, DOM and the Tape: Order Flow Terms Explained Simply
Level 2, DOM and the tape are the three pillars of real‑time order‑flow insight; knowing the vocabulary lets you turn raw data into actionable decisions. Below is a quick‑read glossary that defines each term in one line, shows how the pieces fit together, and points out common pitfalls.
Level 2 (Market Depth)
A snapshot of the limit orders waiting at each price level on the buy (bid) and sell (ask) side, usually displayed as rows of price, size and total. It tells you how much liquidity is available before the market moves.
DOM (Depth of Market)
The same data as Level 2 but presented in a vertical ladder that lets you click to place orders directly at a chosen price. The term emphasizes the interactive, execution‑focused view.
The Tape (Time & Sales)
A scrolling list of every trade that actually occurs, showing price, size and timestamp. It reveals the market’s real‑time buying and selling pressure.
Bid
The highest price a buyer is willing to pay for a contract at that moment.
Ask (Offer)
The lowest price a seller is willing to accept for a contract at that moment.
Spread
The difference between the best ask and best bid. A narrow spread usually means high liquidity; a wide spread signals thin liquidity.
Size (or Volume)
The number of contracts or units represented by a single order or trade line.
Level 2 Row
One line in the depth window, e.g., "10,500 @ 2,300" meaning 2,300 contracts are waiting at the price 10,500.
Iceberg Order
A large hidden order that displays only a small portion (the tip) on Level 2 while the rest remains invisible until the displayed part is filled.
Absorption
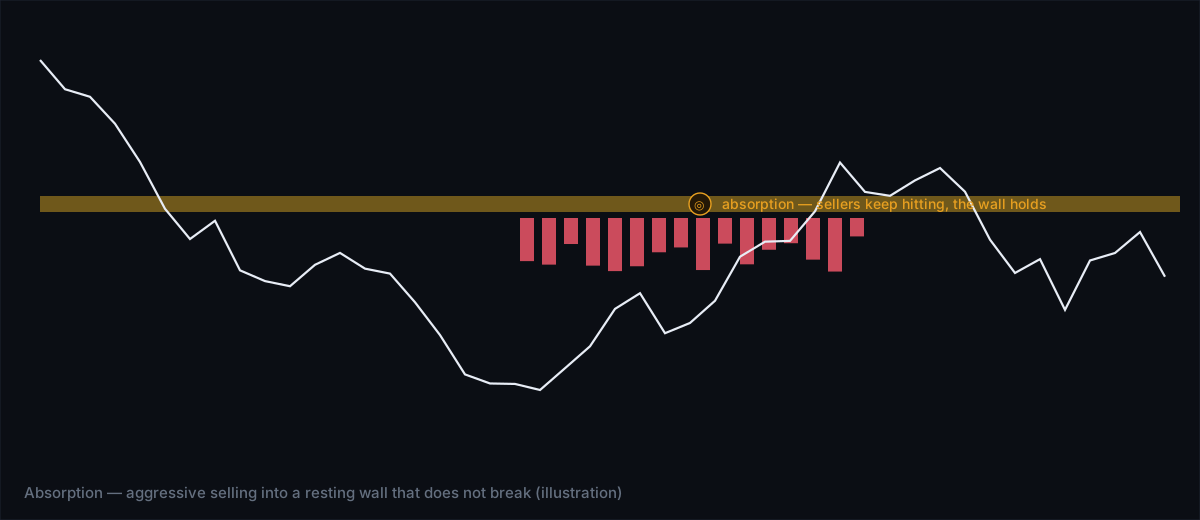
When a large buy or sell order soaks up opposing market orders without moving price, indicating strong hidden liquidity.
Stop Run
A rapid series of trades that pushes price through a cluster of stop‑loss orders, often causing a sharp, temporary move.
Cumulative Volume Delta (CVD)
The running total of buying volume minus selling volume; a rising CVD suggests net buying pressure, a falling CVD suggests net selling.
Liquidity Heatmap
A visual overlay that colours price levels according to the amount of pending liquidity, making large clusters instantly visible.
Footprint Chart
A price‑by‑price chart that displays the exact number of contracts traded at the bid and at the ask for each bar, highlighting imbalance.
Volume Profile (POC/VAH/VAL)
A histogram of traded volume across price levels. POC = point of control (price with most volume); VAH = value area high; VAL = value area low.
Session VWAP (Volume‑Weighted Average Price)
The average price weighted by volume for the current session, often used as a reference point for intraday bias.
Speed of Tape
The rate at which trades appear on the tape, measured in trades per second; high speed indicates aggressive market activity.
How the Three Views Interact
Think of Level 2 as the "order book" – it tells you what could happen. The DOM lets you act on that information with a single click. The tape confirms what actually happened. By cross‑referencing the three, you can spot when hidden liquidity (icebergs) is being absorbed, when a stop run is unfolding, or when a genuine breakout is supported by real buying pressure.
Common Misinterpretations
- "All displayed orders are real": Icebergs and hidden orders mean the visible depth is often a fraction of the true interest.
- "A large trade on the tape means a trend": Single large trades can be institutional sweeps that do not reflect sustained direction.
- "A narrow spread guarantees a good entry": Tight spreads can disappear in fast markets, leading to slippage.
Glossary Comparison Table
| Term | What It Shows | Typical Use |
|---|---|---|
| Level 2 | Pending limit orders by price | Assess liquidity pools before entering |
| DOM | Interactive ladder of Level 2 | Place or modify orders instantly |
| Tape | Executed trades | Validate whether orders are being filled |
| CVD | Net buying vs selling | Gauge directional bias over time |
| Footprint | Bid/ask volume per price | Spot imbalance and potential reversal zones |
Step‑by‑Step Workflow for a Typical Trade
- Open the Level 2 window and locate a cluster of large bids or asks near a recent swing point.
- Switch to the DOM, hover over the price level and place a limit order just inside the cluster.
- Watch the tape as the market approaches. If the trade fills and the CVD continues to rise, confidence in the move increases.
- Use the liquidity heatmap to confirm that the cluster is not being peeled away by a hidden iceberg.
- Set a stop just beyond the nearest liquidity valley (VAL) and monitor for any stop‑run activity on the tape.
Where Tim Edge Helps
Tim Edge’s Flow terminal bundles a liquidity heatmap, footprint chart and automatic iceberg detection into one browser view, letting you apply the workflow above without juggling separate windows. The built‑in market replay also lets you review how the tape, Level 2 and DOM aligned on past trades.
The Bottom Line
Level 2, DOM and the tape each tell a part of the market story; mastering the terminology lets you read that story fluently. Use the glossary as a cheat‑sheet, cross‑check the three views in real time, and avoid the common traps that turn raw data into false signals.