
Overtrading: Recognizing the Data Signature and Stopping It Before It Costs You
Overtrading: The Data Signature and How to Catch It Early
Overtrading shows up as a measurable pattern in a trader’s own numbers: a steady rise in trades per day, an uneven distribution of activity across a trading session, and a sharp jump in trade count after a losing trade. Those three signals—trades‑per‑day drift, session‑time spread, and post‑loss frequency—form a data signature that can be detected before the account takes a hit.
What Does the Overtrading Signature Look Like?
When a trader begins to overtrade, the following three metrics move together:
- Trades‑per‑day drift: the average number of executed trades each day climbs gradually, often by 10‑20% over a few weeks.
- Session‑time spread: activity clusters toward the end of a session or during low‑volatility windows, creating a lopsided histogram of trades across the day.
- Post‑loss frequency spike: the day after a losing trade sees a disproportionate surge in trade count, as the trader tries to “recover” the loss.
Individually each metric can have a benign explanation, but when all three appear together they point to a behavioral bias—usually a mix of revenge trading, loss‑aversion, and a false sense of urgency.
How to Measure Trades‑Per‑Day Drift
Start by calculating the rolling 7‑day average of daily trade count. Plot this line alongside a simple moving average (SMA) of the same period. A drift is present when the 7‑day line consistently stays above the SMA for more than three consecutive days.
Example: If the SMA sits at 12 trades/day and the rolling average climbs to 15, that 25% increase flags a potential drift.
Because the metric is purely count‑based, it is immune to market volatility or instrument choice—making it a clean early‑warning sign.
Analyzing Session‑Time Spread
Break the trading day into equal time buckets (e.g., 30‑minute intervals). Count trades in each bucket and compute the proportion of total daily trades that fall into the first half versus the second half of the session.
A healthy distribution often hovers near 50/50, allowing for natural market rhythms. A skewed ratio—say 30% in the first half and 70% in the second—suggests the trader is chasing the market when liquidity thins, a classic overtrading symptom.
| Time Bucket | Trades |
|---|---|
| 09:00‑09:30 | 2 |
| 09:30‑10:00 | 3 |
| 10:00‑10:30 | 4 |
| 10:30‑11:00 | 5 |
| 11:00‑11:30 | 7 |
| 11:30‑12:00 | 9 |
In the example above, the second half of the session contains 61% of the trades, a red flag if the pattern persists over several days.
Detecting Post‑Loss Frequency Spikes
First, tag each trade as a win or loss. Then, for every losing trade, count the number of trades placed in the following 24‑hour window. Compare that count to the trader’s baseline average daily trade count.
If the post‑loss count exceeds the baseline by more than 30%, the trader is likely engaging in revenge trading—a core component of overtrading.
Step‑by‑Step Checklist to Spot Overtrading Early
- Export your trade log for the past 30 days.
- Calculate the rolling 7‑day average of trades per day.
- Plot the 7‑day average against its SMA; look for sustained upward divergence.
- Divide each trading day into equal time buckets and compute the trade proportion per bucket.
- Check for a consistent skew toward the latter half of the session.
- Mark each loss; count trades in the next 24 hours and compare to your overall daily average.
- If two or more of the three signals appear, schedule a journal review before the next trading session.
Following this checklist takes less than ten minutes a week but can prevent a cascade of impulsive entries.
Why Traditional Journals Miss the Signature
Many traders keep a spreadsheet that records entry price, exit price, and profit. Those fields capture outcomes but not the *behavioural cadence* of trading. Without automatic timestamps, bucket counts, and loss‑triggered trade tallies, the subtle drift remains hidden.
Platforms that auto‑journal each order and tag it with discipline metrics make the signature visible without manual calculation. For example, a system that records every trade’s timestamp, outcome, and session bucket can generate the three charts above with a single click.
Practical Ways to Stop Overtrading Once Detected
Detection is only half the battle. The next step is to embed hard limits that force a pause.
- Trade‑count caps: set a maximum number of trades per day (e.g., 15). Once reached, stop trading for the rest of the session.
- Session‑balance rule: require that no more than 60% of daily trades occur after the session’s midpoint. If the limit is hit, stop trading for the remainder of the day.
- Loss‑recovery lockout: after a losing trade, enforce a mandatory “cool‑down” period of 30 minutes before the next entry is allowed.
These rules are mechanical, removing the emotional decision‑making that fuels overtrading.
How Tim Edge Helps Identify Overtrading
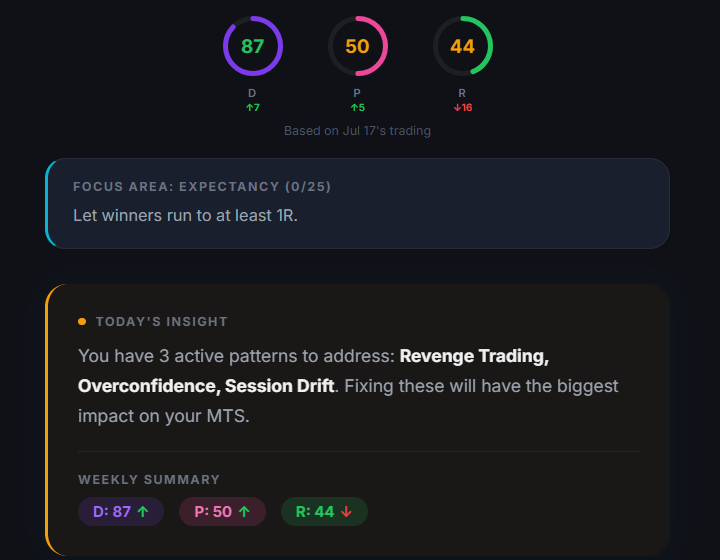
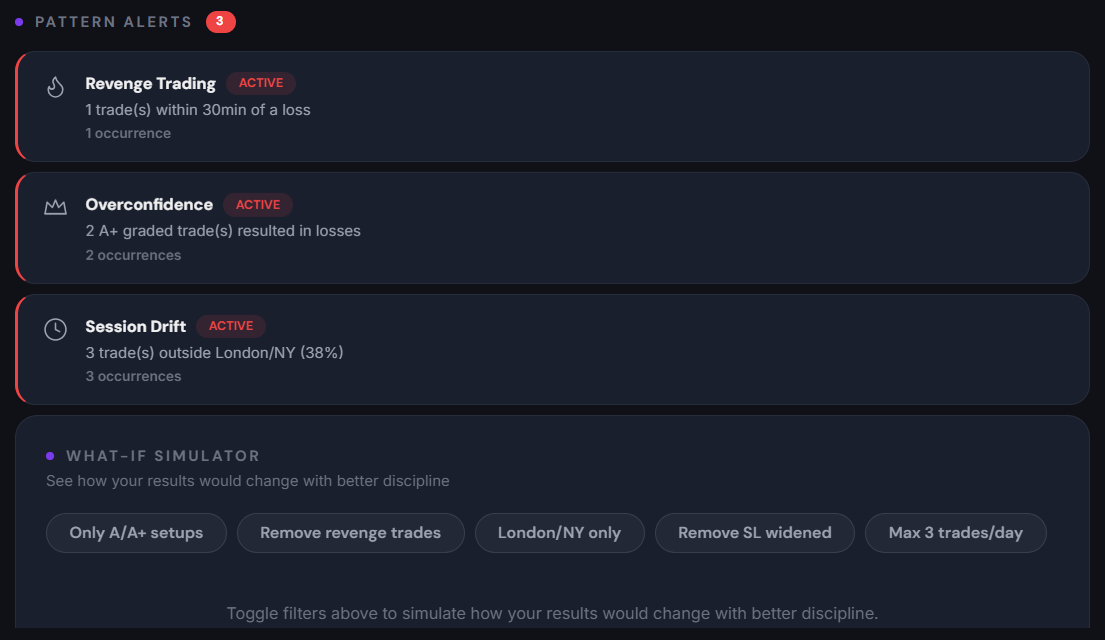
Tim Edge’s automatic trade journal records every order with precise timestamps, making it easy to calculate the three signature metrics. Its behavioural analytics feature highlights drift, session spread, and post‑loss spikes in real time, so you can see the warning signs before an extra trade is placed.
The Bottom Line
Overtrading leaves a clear data fingerprint: a rising daily trade count, a lopsided session‑time distribution, and a spike in activity after a loss. By measuring these three signals with a simple weekly routine, you can catch the bias early and apply mechanical limits to protect your capital. Automated journaling tools make the process painless and reliable, turning raw trade data into a real‑time discipline guard.