
What Is Behavioural Trading Analytics? A Plain‑English Guide for Retail Traders

What Is Behavioural Trading Analytics?
Behavioural trading analytics is the systematic study of how you trade, not just what you earn. It turns every order, stop, and position into data points that reveal patterns of discipline, consistency and unconscious tilt (bias). While a profit‑and‑loss (P&L) statement tells you the end result, behavioural analytics tells you why you got there.
Why Look Beyond P&L?
A trader can post a winning month and still be on a fragile path to ruin. A single lucky trade can mask a habit of over‑trading, missed stop‑losses, or a tendency to chase after a losing position. Behavioural analytics surfaces those habits by measuring:
- Discipline: Did you obey your own rules for entry, exit and risk?
- Consistency: Are your win‑rate, average risk‑reward and trade size stable over time?
- Tilt detection: Are you unintentionally favoring one side of the market after a loss or a win?
Understanding these dimensions lets you intervene before a streak of bad habits erodes your capital.
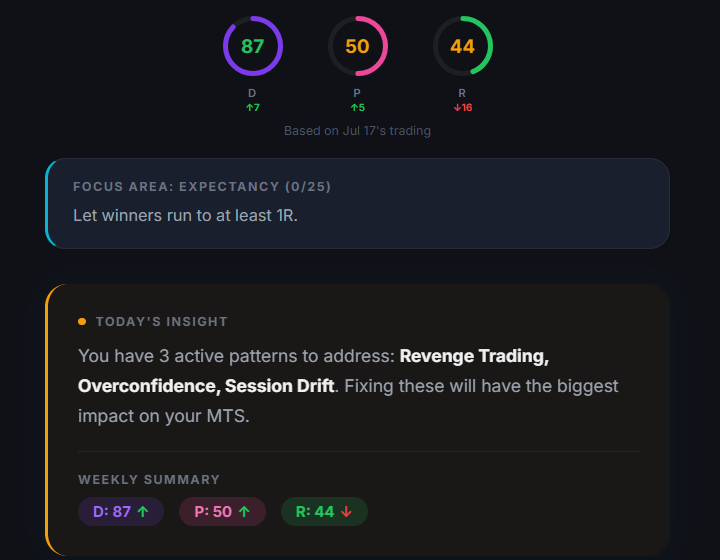
How Does Behavioural Analytics Work?
The process is simple in concept but powerful in execution:
- Every trade you place is automatically logged – entry price, size, time, stop, target, and the reason you took it.
- The platform tags each trade with contextual data: market condition, volatility, and whether the trade followed a predefined strategy.
- Algorithms scan the log for rule breaches (e.g., missing a stop), variance in trade size, and patterns that suggest emotional bias.
- Results are presented as clear metrics and visual cues, allowing you to see where your behaviour diverges from your plan.
Because the data comes from your own trading history, the insights are personalized and actionable.
Key Metrics Tracked in Behavioural Analytics
| Metric | What It Shows | Typical Action |
|---|---|---|
| Stop‑Loss Adherence Rate | Percentage of trades where the stop was hit or manually closed at the predefined level. | Adjust position sizing or tighten stop‑placement rules if rate falls below 90%. |
| Average Trade Size Variance | Standard deviation of position size relative to your target risk per trade. | Implement a max‑size cap if variance spikes after a loss streak. |
| Rule‑Break Frequency | Number of times you entered a trade outside your stated criteria (e.g., no confluence, wrong time‑frame). | Review the rule‑break log to identify why you deviated – fatigue, news, or over‑confidence. |
| Side‑Bias Index | Difference between long and short trade counts after a win or loss. | Introduce a “balance‑the‑books” rule if bias exceeds 20% for more than three sessions. |
| Trade‑Timing Consistency | Distribution of trade times relative to your preferred trading window. | Limit after‑hours trading if a large share occurs outside your optimal window. |
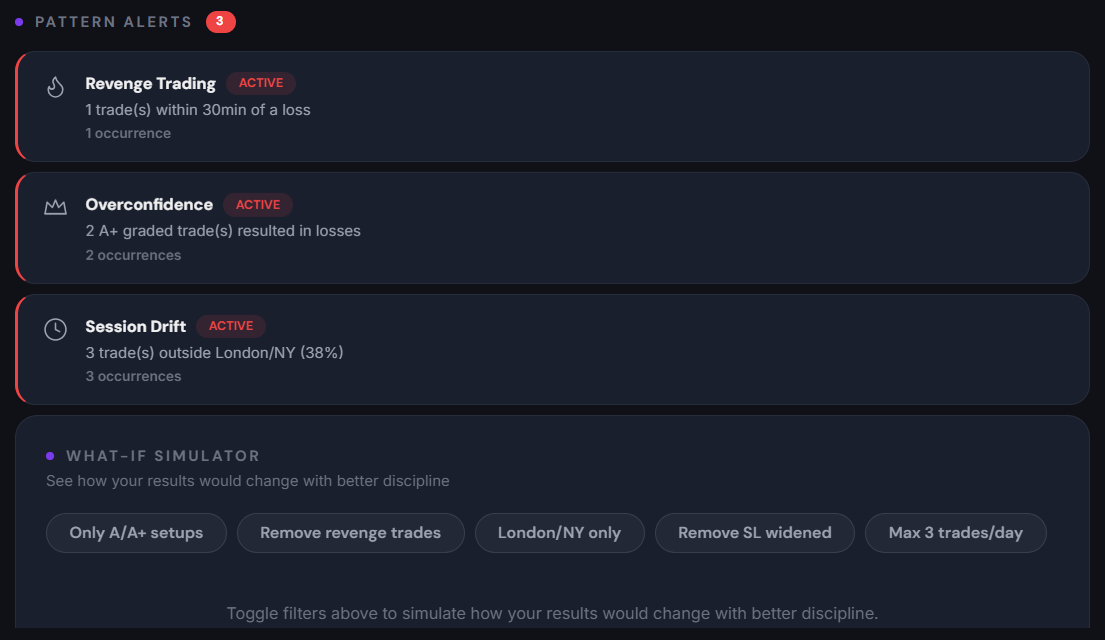
Detecting Tilt: When Emotions Drive the Market View
Tilt is the subtle shift in your perception after a recent outcome. A win may make you over‑confident, pushing you to increase size or ignore stops. A loss can cause revenge‑trading, where you chase the market to recover quickly.
Behavioural analytics flags tilt by comparing the pre‑event baseline (average metrics over the prior 20 trades) with the post‑event window (the next 5‑10 trades). A sharp rise in average trade size or a sudden swing in side‑bias triggers an alert.
Because the detection is automatic, you get the warning before the tilt can cause a cascade of losses.
Integrating Behavioural Analytics with Other Tools
Behavioural data becomes even more useful when paired with order‑flow information. For example, if your tilt index shows a bias toward buying, you can cross‑check the liquidity heatmap to see whether the market actually has buying pressure or if you are simply chasing a false signal.
Platforms that combine an automatic trade journal, behavioural analytics and live order‑flow terminals let you close the feedback loop in real time. Tim Edge offers such an integrated suite, providing the journal, analytics and Flow lenses (liquidity heatmap, footprint chart, etc.) in a single browser‑based environment.
Common Pitfalls When Using Behavioural Analytics
- Ignoring the data: Logging every trade is useless if you never review the metrics.
- Over‑reacting to a single outlier: One large deviation does not necessarily indicate a systemic problem; look for trends over multiple sessions.
- Setting unrealistic thresholds: Expecting a 100% stop‑loss adherence rate is impractical; aim for a level that reflects your risk tolerance.
- Relying solely on numbers: Metrics should guide, not replace, thoughtful post‑trade analysis.
Getting Started: A Simple 5‑Day Routine
- Enable automatic journaling on every platform you trade.
- Define three core rules (e.g., risk per trade, stop‑loss placement, entry criteria).
- At the end of each trading day, review the discipline dashboard – note any rule breaks.
- On a weekly basis, examine the consistency charts for trade‑size variance and side‑bias.
- Adjust your plan before the next week’s session based on the insights.
This routine builds a habit of data‑driven self‑correction without overwhelming you with raw numbers.
The Bottom Line
Behavioural trading analytics transforms raw trade logs into a mirror that reflects your true trading habits. By measuring discipline, consistency and tilt, you can spot hidden weaknesses long before they erode your capital. Pairing these insights with order‑flow tools creates a feedback loop that keeps your edge sharp and your decisions grounded in data, not emotion.