
Revenge Trading: How Your Journal Exposes It Before It Kills Your Account
Revenge Trading: How Your Journal Exposes It Before It Kills Your Account
Revenge trading shows up in your journal as a burst of losing‑follow‑up trades, larger position sizes, and a sudden shift in timing. By reading those patterns early, you can break the cycle before it erodes your capital.
What does revenge trading look like in the data?
When a trader suffers a loss, the emotional impulse to “win it back” creates three observable signals in an automatic journal:
- Trade clustering – a series of trades entered within a short window after a loss, often ignoring the usual market‑open routine.
- Size creep – the average dollar or contract size of those post‑loss trades is higher than the trader’s normal stake.
- Timing deviation – entries occur at atypical times (e.g., during low‑volume periods) because the trader is chasing any perceived opportunity.
These signals are not random; they stem from the same psychological trigger: the need to recover a recent hit.
Why a journal is the only reliable detector
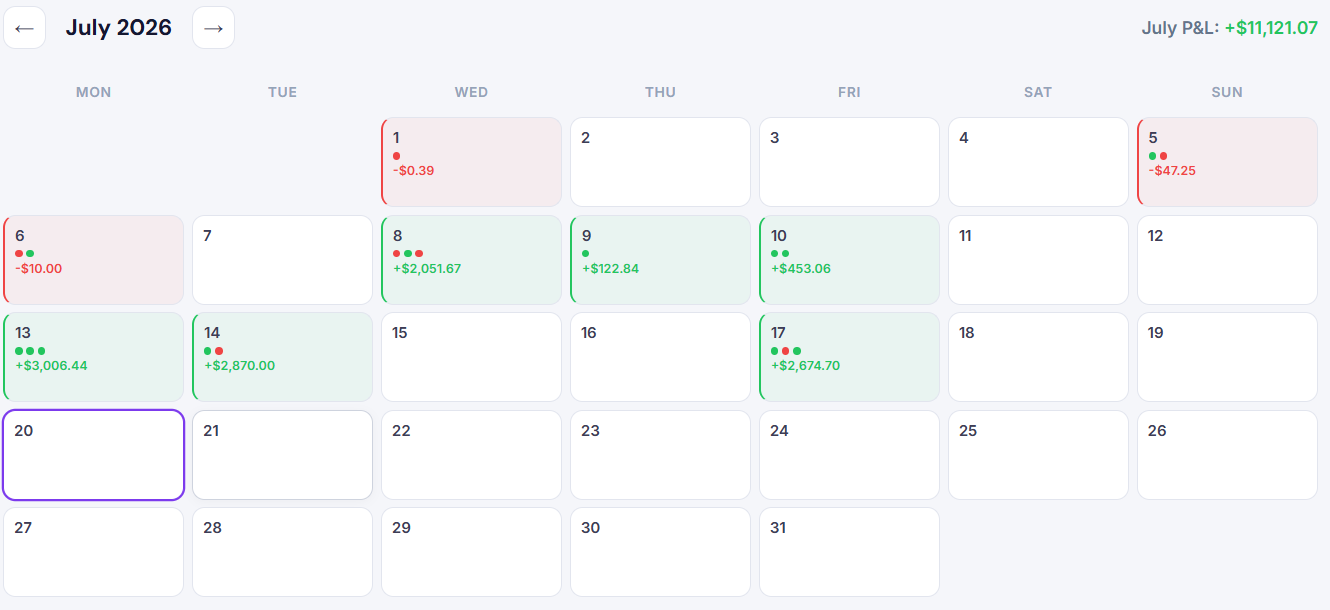
Manual spreadsheets rely on memory and selective entry, which means the very bias you’re trying to catch can hide the evidence. An automatic journal records every order, size, and timestamp without omission, turning subjective feelings into objective data points. The behavioural analytics module then aggregates those points into metrics that flag abnormal clusters.
How to spot revenge trading in your own record
- Identify clusters of trades that occur shortly after a losing trade.
- Compare the average size of post‑loss trades to your overall average trade size; a noticeable increase may indicate size creep.
- Look for unusually short intervals between trades after a loss, which can signal impulsive re‑entry.
- Review any notes you add to your journal for language that reflects a “make‑up‑for‑it” mindset.
When multiple of these conditions appear together, you have a strong indication of revenge trading.
Common pitfalls when trying to self‑diagnose
Many traders think they can spot revenge trading by feeling uneasy after a loss. That feeling is useful, but it is also easily masked by other emotions such as fear or boredom. Relying on intuition alone leads to three typical mistakes:
- Confirmation bias – remembering only the trades that fit the narrative and ignoring the rest.
- Post‑hoc rationalisation – rewriting the story after the fact to make the loss look justified.
- Selective logging – omitting small “recovery” trades because they seem insignificant, which skews the data.
Automatic journaling eliminates these errors by capturing every order, regardless of size or perceived importance.
Practical steps to break the revenge cycle
Once the journal flags a revenge pattern, take a systematic approach:
- Pause the session. Step away from the screen and give yourself time to cool down.
- Review the loss objectively. Use the replay feature to watch the market move before, during, and after the loss. Identify whether the original trade followed your plan.
- Reset position sizing. Manually adjust your stake back to the pre‑loss level to prevent size creep.
- Document the lesson. Write a brief note about the emotional trigger and the corrective action taken. This creates a feedback loop that reinforces discipline.
- Re‑evaluate the strategy. If revenge trading repeats, consider whether the underlying strategy produces too many small losses and may need redesign.
These actions turn a reactive habit into a data‑driven process.
Comparison of journal features that catch revenge trading
| Feature | What it measures | How it helps stop revenge trading |
|---|---|---|
| Trade clustering detection | Number of trades entered shortly after a loss | Immediate flag when impulsive re‑entry spikes |
| Size creep indicator | Post‑loss average size versus overall average size | Highlights dangerous over‑leveraging |
| Timing deviation view | Intervals between trades after a loss | Shows abnormal clustering patterns |
Why Tim Edge’s journal is especially useful for this problem
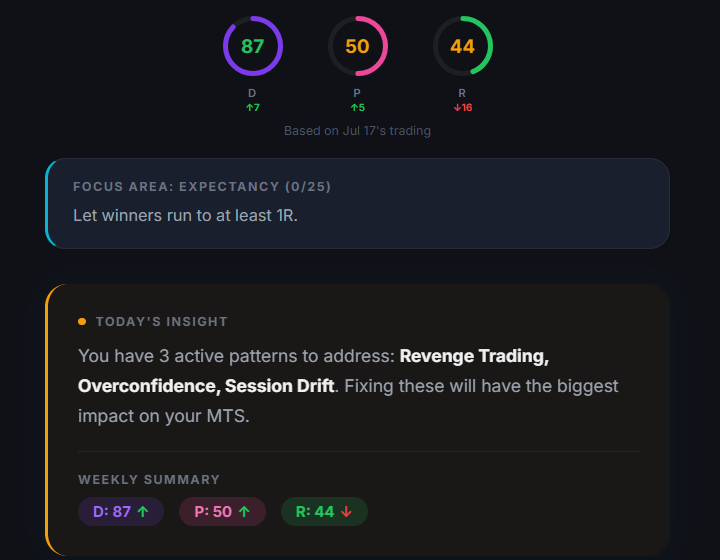
Tim Edge’s journal records every trade by itself the second it closes, so nothing gets left out on a bad day. Its behavioural analytics flag revenge trading, overtrading and growing position size in your own trading, and a daily Readiness score tells you whether you should be trading today at all. If you trade Bitcoin or gold, Replay lets you step back through the session and see what the market was actually doing around the loss.
Because the journal is built into a single platform, you avoid the fragmentation that occurs when you try to combine a spreadsheet, a separate execution tool, and a third‑party analytics add‑on.
The bottom line
Revenge trading leaves a clear fingerprint: rapid trade clustering, inflated position sizes, and irregular timing. An automatic journal captures those signals, turns them into actionable metrics, and can help you pause and reflect before acting on impulse. By letting the data speak, you replace emotion with evidence and protect your account from self‑inflicted loss.