
The Journal Metrics That Actually Predict Profitability

The Journal Metrics That Actually Predict Profitability
Expectancy, average R, and drawdown behavior are the three journal metrics that reliably forecast whether a retail trader will be profitable over time. Unlike win rate, which can be misleading, these numbers stem directly from the risk‑reward profile of each trade and the way capital is managed across a series of positions.
Why win rate isn’t the right predictor
Win rate simply counts how many trades close in profit versus loss. A trader can win 90% of trades and still lose money if the losing trades are much larger than the winners. The metric ignores two critical dimensions:
- Risk per trade – how much capital is at stake on each entry.
- Reward per trade – the average profit when a trade is successful.
Because win rate treats every win and loss as equal, it masks the true profitability equation. The journal metrics we focus on capture both size and frequency, giving a realistic view of the strategy’s edge.
Expectancy: the single most telling number
Expectancy is the average profit (or loss) you can expect per unit of risk. It is calculated as:
Expectancy = (Probability of Win × Average Win) – (Probability of Loss × Average Loss)
When you record each trade’s risk (the amount you were willing to lose) and its outcome, the formula converts raw results into a per‑risk unit figure. A positive expectancy (>0) means the system makes money over the long run; a negative expectancy signals the opposite.
Because expectancy incorporates both win rate and average R, it eliminates the need to look at those components separately. It also scales with position size, so you can compare strategies that trade different instruments or use different capital allocations.
Average R: measuring the true reward‑to‑risk ratio
Average R is the mean of the reward‑to‑risk ratio across all trades. The reward‑to‑risk ratio (R) for a single trade is:
R = (Profit – Entry) ÷ (Entry – Stop‑Loss)
When you log the exact stop‑loss level for every trade, the journal can compute R automatically. An average R above 1.0 indicates that, on average, winners exceed the amount risked. Below 1.0 suggests that even a high win rate may not be enough to overcome the size of losses.
Average R is especially useful when paired with expectancy. Two strategies can have the same expectancy, but one may achieve it with a high average R and lower win rate, while the other relies on a high win rate and low average R. Understanding the mix helps you decide which style fits your psychology and capital constraints.
Drawdown behavior: how capital erosion reveals hidden risk
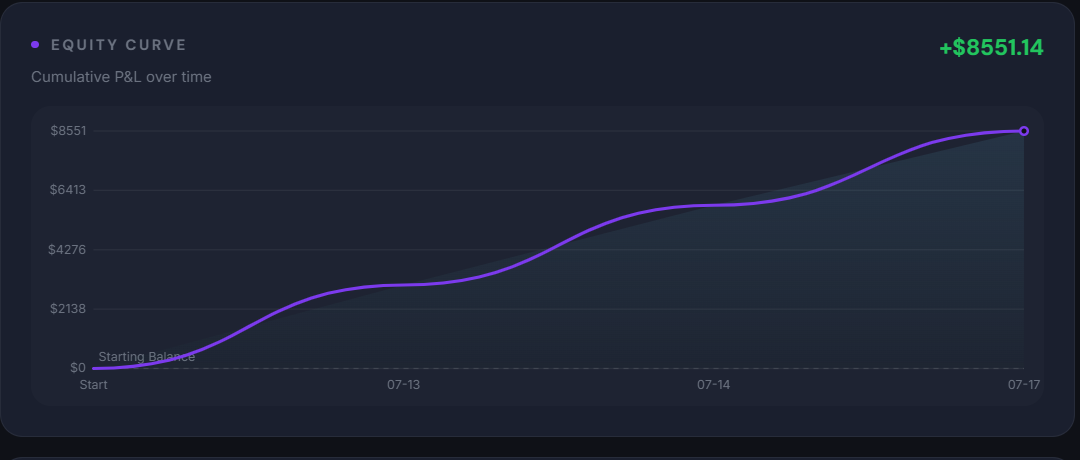
Drawdown is the peak‑to‑trough decline in equity. While many traders track maximum drawdown as a single number, the pattern of drawdowns tells a deeper story. Key aspects to journal:
- Frequency – how often the equity curve dips below a given threshold.
- Depth – the size of each dip relative to the account size.
- Recovery time – how many trades or days it takes to regain the lost equity.
By tagging each trade with its contribution to drawdown, you can see whether losses cluster (suggesting a systematic flaw) or are scattered (more random). Consistently long recovery periods often point to over‑leveraging or inadequate position sizing, even if expectancy remains positive.
Putting the metrics together: a practical workflow
Below is a step‑by‑step process you can adopt in any journal—manual or automated—to extract these metrics and interpret them.
- Record every trade with the following fields: entry price, exit price, stop‑loss price, position size, and timestamp.
- Calculate the risk amount (position size × distance to stop‑loss) and the profit amount (position size × distance to exit).
- Derive R for each trade (profit ÷ risk) and flag whether the trade was a win or loss.
- At the end of each day, compute daily expectancy using the formula above. Accumulate these to get a rolling expectancy over 30‑day, 90‑day, and 180‑day windows.
- Average the R values of all trades in the same window to obtain average R.
- Track equity after each trade; compute drawdown depth, frequency, and recovery time for the same windows.
- Review the three metrics together: a positive expectancy, average R > 1, and drawdown that recovers within a reasonable number of trades indicate a robust edge.
Comparing metric‑focused journals vs. traditional win‑rate journals
| Feature | Metric‑Focused Journal | Win‑Rate‑Only Journal |
|---|---|---|
| Core calculation | Expectancy, average R, drawdown dynamics | Win percentage |
| Insight into risk | High – tracks stop‑loss and position size per trade | Low – often ignores trade size |
| Actionable feedback | Adjust position sizing, tighten stops, refine entry criteria | May suggest “trade more” without addressing loss size |
| Predictive power | Directly linked to long‑term profitability | Can be misleading if win rate is high but R is low |
How Tim Edge can automate these calculations
Tim Edge’s automatic trade journal captures entry, exit, and stop‑loss levels for every trade without manual entry. Its behavioural analytics module then computes expectancy, average R, and detailed drawdown statistics in real time. Because the data is stored tick‑by‑tick, the metrics reflect the exact risk taken, eliminating the estimation errors common in spreadsheet journals.
The bottom line
Focus your journal on expectancy, average R, and drawdown behavior rather than win rate. These three metrics together give a clear, mathematically sound picture of whether a strategy will generate profit over the long haul. By recording risk precisely and reviewing the metrics regularly, you can spot weaknesses early, adjust position sizing, and keep capital growth on track.