
The Trading Stack: Essential Tools Serious Retail Traders Use for Charting, Journaling, Flow and Execution
The Trading Stack: What Serious Retail Traders Actually Use
Serious retail traders combine four core components—charting, journaling, order‑flow analysis, and execution—to turn ideas into consistent results. The stack works like a production line: a chart shows the setup, a journal records the decision, flow tools confirm market intent, and a fast execution engine locks in the trade.
Why a Unified Stack Beats a Patchwork of Apps
When each piece lives in a separate program, data must be copied manually, timing slips, and insights get lost. A unified stack keeps every datum—price, order‑flow signal, trade‑log entry—in one place, so you can see cause and effect instantly. This reduces friction, improves discipline, and makes post‑trade analysis reliable.
Charting: From Candles to Real‑Time Heatmaps
Charting is the visual foundation. Most traders start with traditional candlesticks, but serious traders add layers that reveal hidden liquidity:
- Liquidity heatmap – colors the price ladder by the amount of resting orders, highlighting where large players may defend or attack.
- Footprint chart – shows the exact number of contracts or coins traded at each price, exposing bid/ask imbalances.
- Volume profile (POC/VAH/VAL) – plots where most volume has occurred (Point of Control) and the high/low boundaries, giving a reference for value areas.
These overlays turn a static price picture into a live map of market intent. The key is to keep the charting window open while you monitor flow, so you can spot a breakout and instantly see whether the underlying order book supports it.
Journaling: Turning Every Trade Into Data
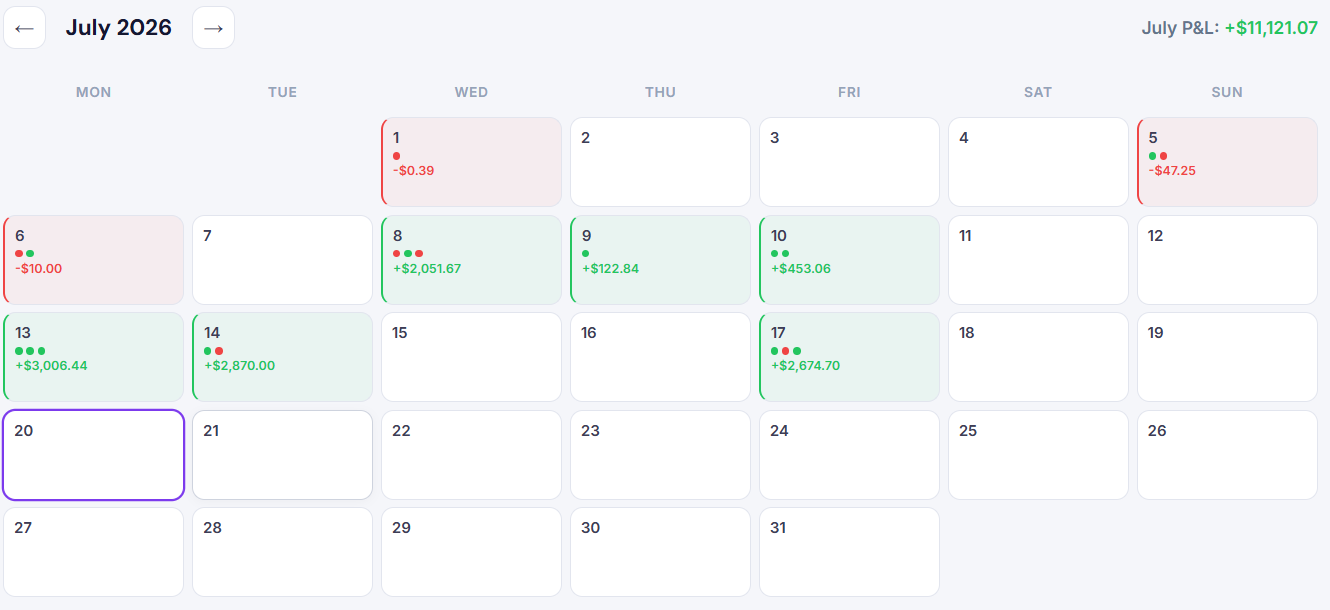
Even the best chart setup is useless if you cannot recall why you entered a trade. An automatic trade journal captures the entry price, time, position size, and the exact chart snapshot. It also logs behavioural metrics—how many trades you took in a session, the time between signals, and whether you deviated from your plan.
Manual spreadsheets often miss these nuances, leading to incomplete records and biased post‑mortems. An auto‑journal eliminates the “I forgot” gap and provides a reliable dataset for behavioural analytics.
Order‑Flow Analysis: The Real‑Time Decision Engine
Order‑flow tools translate raw market activity into actionable signals. The most useful lenses for serious traders are:
- Cumulative Volume Delta (CVD) – the net difference between buying and selling volume over time, showing whether buyers or sellers are in control.
- Speed of tape – measures how quickly trades are occurring; spikes often precede rapid price moves.
- Iceberg detection – identifies large hidden orders that are split into small pieces, a common tactic of institutions.
- Absorption & stop‑run detection – spots when large liquidity is being consumed (absorption) or when price pushes through stop levels (stop runs).
- 24/7 automatic alerts – the system flags icebergs, absorption, and stop runs as they happen, and each alert is journaled for replay.
These flow lenses work on Bitcoin and Gold, giving you a consistent view across the two most liquid non‑equity assets.
Execution: From Idea to Filled Trade in Sub‑Seconds
Execution speed matters because order‑flow signals can decay within milliseconds. A sub‑second execution engine takes the signal from the flow window and sends the order directly to the market, bypassing manual clicks. This reduces slippage—the difference between the expected price and the actual fill—and preserves the edge identified by the flow analysis.
Live algo deployment also lets you codify repeatable patterns, such as “enter long when CVD crosses above zero and a liquidity bubble appears at the POC.” The algorithm watches the conditions and executes instantly, removing human reaction time.
Putting It All Together: A Sample Trade Workflow
Below is a step‑by‑step illustration of how a serious trader moves from observation to execution using the stack.
- Open the chart with footprint and volume‑profile overlays.
- Watch the flow window for a rising CVD and a speed‑of‑tape spike near the POC.
- Confirm an iceberg detection at the same price level—this suggests institutional interest.
- Log the setup automatically; the journal records the price, time, and flow metrics.
- Trigger the live algo or click the sub‑second execution button to enter the trade.
- After exit, the journal adds the outcome and the flow window replays the entire sequence for post‑trade review.
Comparing Popular Retail Stacks
Many platforms claim to offer parts of this stack, but only a few integrate all four layers. The table below compares three well‑known solutions on the criteria that matter to serious traders.
| Feature | Platform A | Platform B | Integrated Stack |
|---|---|---|---|
| Advanced chart overlays (heatmap, footprint) | Yes | Limited | Yes |
| Automatic trade journaling | No | Yes (manual import) | Yes |
| Real‑time flow lenses (CVD, iceberg detection) | Partial | Yes | Yes |
| Sub‑second algo execution | No | Limited | Yes |
| Behavioural analytics | No | No | Yes |
The Bottom Line
The trading stack that serious retail traders rely on combines robust charting, automatic journaling, deep order‑flow analysis, and ultra‑fast execution. When these components speak to each other, you can see the market’s intent, act on it instantly, and learn from every trade. Using an integrated solution keeps the workflow tight and the data clean, which is the real edge in today’s fast markets.