
15‑Minute Weekly Trade Review Routine That Compounds Your Edge

What a 15‑minute weekly trade review looks like
In just fifteen minutes you can turn a week’s worth of trading activity into a measurable edge. The routine pulls raw journal entries, behavioural metrics, and execution data, then distills them into three actionable outcomes: what to keep, what to tweak, and what to drop.
Why a short, focused review beats a marathon analysis
Most traders treat the weekly review as a deep‑dive that can take an hour or more. The problem is two‑fold: fatigue clouds judgment, and the sheer volume of data creates analysis paralysis. By limiting the review to fifteen minutes you force yourself to look only at the highest‑impact signals – the ones that actually move your expectancy. The discipline of a timer also mirrors the discipline required for live trading, reinforcing the habit of concise decision‑making.
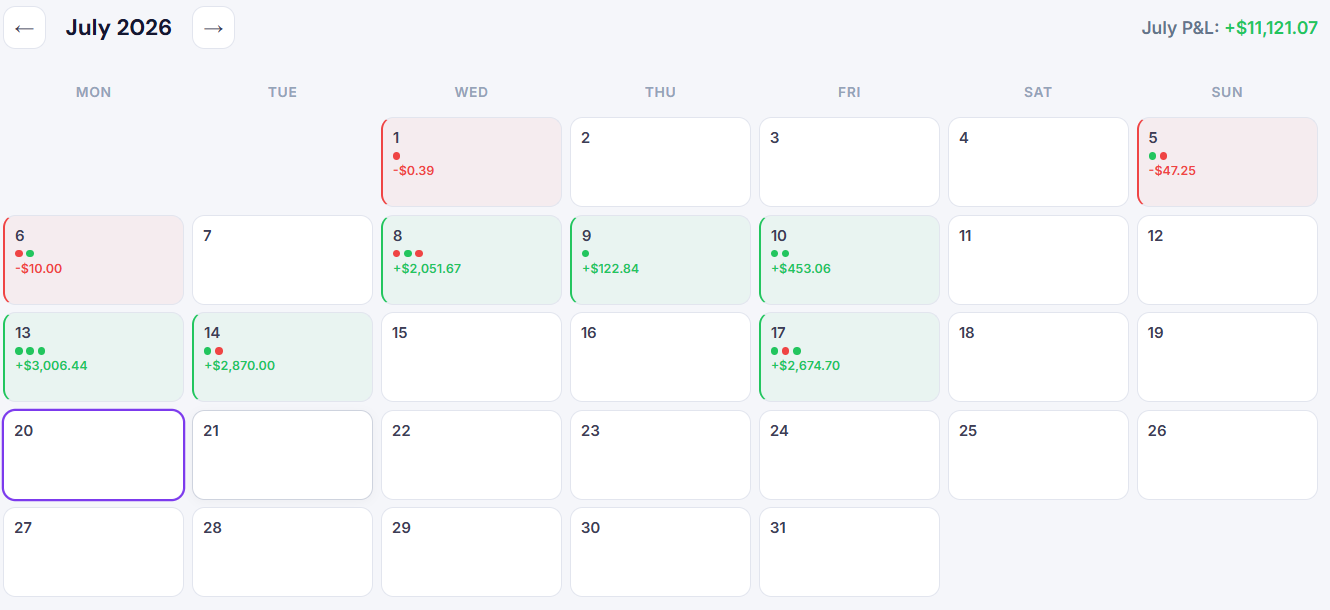
Step‑by‑step 15‑minute checklist
- Set a timer for 15 minutes and open your automatic trade journal. A digital journal eliminates manual entry errors and timestamps every trade, making the next steps instant.
- Pull the three core performance metrics.
- Average R‑multiple (average profit or loss expressed in risk units). This tells you whether your risk‑reward setup is working.
- Win‑rate (percentage of winning trades). Use it only as context, not as the main performance driver.
- Maximum drawdown percentage for the week. This reveals whether you are breaching your risk tolerance.
- Identify behavioural outliers. Look at the discipline analytics column that flags trades taken outside your pre‑set rules – for example, “trade entered after a loss streak” or “size larger than plan.” Record the count.
- Spot consistency gaps. Filter the journal for “time‑of‑day” and “session” tags. Are you consistently profitable in the first hour of the session but erratic later? Note the pattern.
- Review execution quality. Pull the sub‑second execution log (if you use algo deployment) and check for any slippage spikes above 0.2% of the intended entry price. High slippage often signals liquidity issues that need a different entry strategy.
- Write a three‑sentence summary. Include:
- What worked (e.g., “breakout entries on the 2‑minute chart produced +1.8R average”).
- What didn’t (e.g., “adding to losing positions after a drawdown >2% of equity”).
- One concrete tweak for next week (e.g., “limit position size to 1% of equity on Friday trades”).
- Log the tweak in the journal’s “action items” field. Because the journal is automatic, the entry is timestamped and will appear in next week’s review count, giving you a built‑in accountability loop.
How the checklist compounds over time
Each weekly cycle adds a data point to two growing series: behavioural compliance and execution efficiency. When you see the compliance count drop from three out‑of‑rule trades to zero over several weeks, the probability of large, rule‑breaking losses shrinks dramatically. Likewise, tracking slippage week after week lets you fine‑tune order‑flow tactics, such as using the liquidity heatmap or reviewing iceberg detection, so you consistently capture better fills.
Common pitfalls and how to avoid them
- Skipping the timer. Without a hard limit you drift back into the “analysis paralysis” trap. Set a phone alarm and stick to it.
- Focusing on win‑rate alone. A high win‑rate can mask a negative expectancy if average losses are larger than average wins. Keep the R‑multiple front and centre.
- Ignoring behavioural flags. The journal may highlight “size creep” or “post‑loss clustering.” Treat these flags as red lights, not optional data.
- Changing too many variables at once. Pick one tweak per week – the three‑sentence summary forces you to do exactly that.
Tools that make the fifteen‑minute routine painless
| Feature | Why it matters for the weekly review |
|---|---|
| Automatic trade journal | Eliminates manual logging and provides the raw data needed for review. |
| Behavioural analytics | Flags rule breaches, size creep, and consistency gaps automatically. |
| AI Strategy Builder with tick‑level backtesting | Shows whether a tweak you plan to test has realistic intrabar sequencing. |
| Tim Edge Flow (liquidity heatmap, iceberg detection, CVD) | Provides the execution data needed to assess slippage and order‑flow quality. |
These components are bundled in the Edge Advanced plan, but the core journal and behavioural analytics are available on the lower tiers as well.
The bottom line
A disciplined fifteen‑minute weekly review converts raw journal data into three clear actions: reinforce winners, correct rule breaches, and tighten execution. Repeating this routine week after week compounds small improvements into a measurable edge, while keeping the process fast enough to stay consistent.